From the BLS:
Nonfarm payroll employment edged up in March (+88,000), and the unemployment rate was little changed at 7.6 percent, the U.S. Bureau of Labor Statistics reported today. …
…
The change in total nonfarm payroll employment for January was revised from +119,000 to +148,000, and the change for February was revised from +236,000 to +268,000.
The headline number was well below expectations of 193,000 payroll jobs added. However employment for January and February were revised higher.
 Click on graph for larger image.
NOTE: This graph is ex-Census meaning the impact of the decennial Census temporary hires and layoffs is removed to show the underlying payroll changes.
The second graph shows the unemployment rate.
The unemployment rate decreased to 7.6% from 7.7% in February.
 The unemployment rate is from the household report and the household report showed a sharp decline in the labor force – and that meant a lower unemployment rate.
The labor force (household survey) declined from 155.524 million to 155.028 million – a decline of 496 thousand.
The third graph shows the employment population ratio and the participation rate.
The Labor Force Participation Rate decreased to 63.3% in March (blue line). This is the percentage of the working age population in the labor force.
 The participation rate is well below the 66% to 67% rate that was normal over the last 20 years, although a significant portion of the recent decline is due to demographics.
The Employment-Population ratio was also declined to 58.5% in March (black line). I’ll post the 25 to 54 age group employment-population ratio graph later.
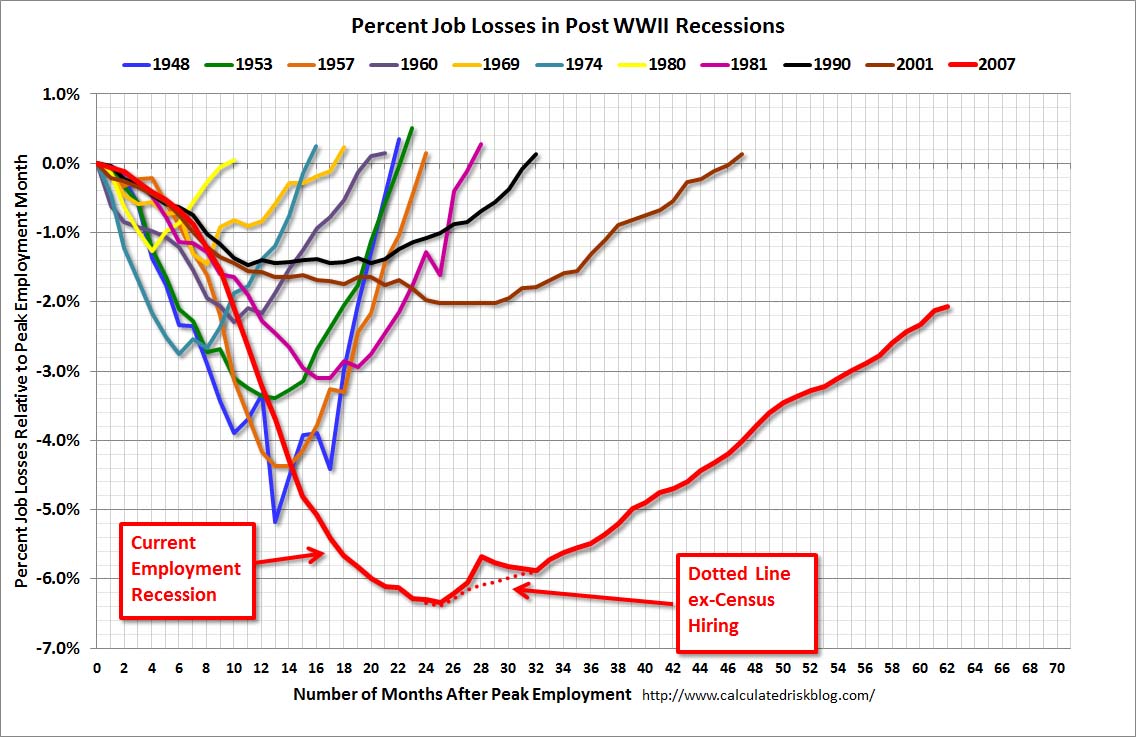 The fourth graph shows the job losses from the start of the employment recession, in percentage terms, compared to previous post WWII recessions. The dotted line is ex-Census hiring.
This shows the depth of the recent employment recession – worse than any other post-war recession – and the relatively slow recovery due to the lingering effects of the housing bust and financial crisis.
This was a disappointing employment report and worse than expectations. I’ll have much more later …