“Disappointing” and “below expectations” were the most used phrases to describe the economic releases last week. Even though growth in Q1 was better than in Q4 2012, it appears the first quarter ended sluggishly.
The employment report was well below expectations with only 88,000 payroll jobs added, the ISM manufacturing and service indexes indicated slower growth in March, initial weekly unemployment claims increased sharply, and even auto sales were a little disappointing.
On the positive side, construction spending increased, and it appears the layoffs at the state and local government level are ending (two of the key reasons I’m more optimistic this year).
But overall it was a disappointing week. I expect some slowdown over the next couple of quarters related to policy (sequestration), but I think the key drivers for growth are still positive.
Here is a summary of last week in graphs:
• March Employment Report: 88,000 Jobs, 7.6% Unemployment Rate
 Click on graph for larger image.
NOTE: This graph is ex-Census meaning the impact of the decennial Census temporary hires and layoffs is removed to show the underlying payroll changes.
From the BLS: “Nonfarm payroll employment edged up in March (+88,000), and the unemployment rate was little changed at 7.6 percent, the U.S. Bureau of Labor Statistics reported today. … The change in total nonfarm payroll employment for January was revised from +119,000 to +148,000, and the change for February was revised from +236,000 to +268,000.”
The headline number was well below expectations of 193,000 payroll jobs added. However employment for January and February were revised higher.
 The second graph shows the unemployment rate.
The unemployment rate decreased to 7.6% from 7.7% in February.
The unemployment rate is from the household report and the household report showed a sharp decline in the labor force – and that meant a lower unemployment rate.
The labor force (household survey) declined from 155.524 million to 155.028 million – a decline of 496 thousand.
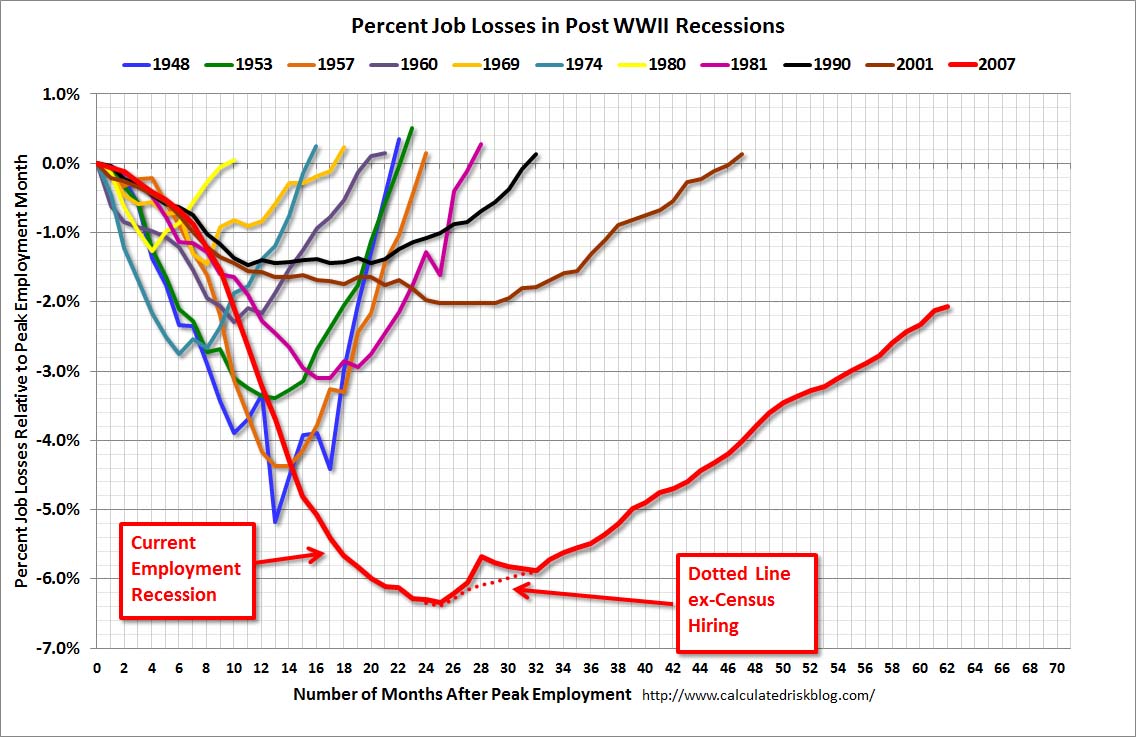 This graph shows the job losses from the start of the employment recession, in percentage terms, compared to previous post WWII recessions. The dotted line is ex-Census hiring.
This shows the depth of the recent employment recession – worse than any other post-war recession – and the relatively slow recovery due to the lingering effects of the housing bust and financial crisis.
This was a disappointing employment report and worse than expectations.
• ISM Manufacturing index declines in March to 51.3
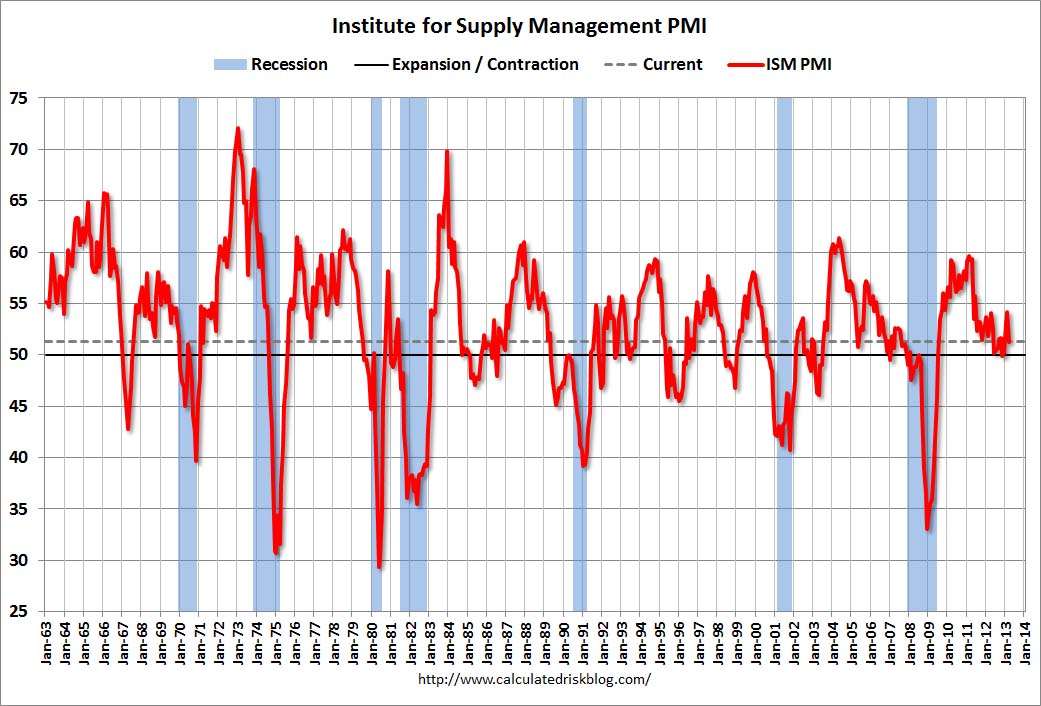 The ISM manufacturing index indicated expansion in March. The PMI was at 51.3% in March, down from 54.2% in February. The employment index was at 54.2%, up from 52.6%, and the new orders index was at 51.4%, down from 57.8% in February.
Here is a long term graph of the ISM manufacturing index.
This was below expectations of 54.0% and suggests manufacturing expanded at a slower pace in March.
• ISM Non-Manufacturing Index indicates slower expansion in March
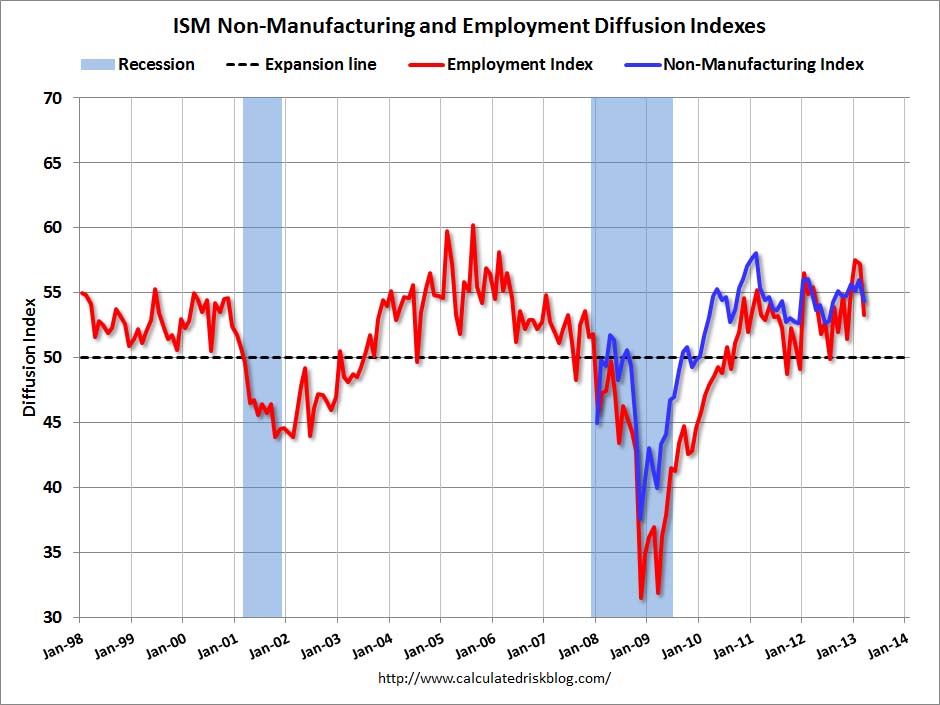 The March ISM Non-manufacturing index was at 54.4%, down from 56.0% in February. The employment index decreased in March to 53.3%, down from 57.2% in February. Note: Above 50 indicates expansion, below 50 contraction.
This graph shows the ISM non-manufacturing index (started in January 2008) and the ISM non-manufacturing employment diffusion index.
This was below the consensus forecast of 56.0% and indicates slower expansion in March than in February.
• U.S. Light Vehicle Sales decreased to 15.3 million annual rate in March
 Based on an estimate from AutoData Corp, light vehicle sales were at a 15.27 million SAAR in March. That is up 8% from March 2012, and down slightly from the sales rate last month.
This was below the consensus forecast of 15.4 million SAAR (seasonally adjusted annual rate).
Note: dashed line is current estimated sales rate.
This is a solid start to the new year. After three consecutive years of double digit auto sales growth, the growth rate will probably slow in 2013 – but this will still be another positive year for the auto industry.
Even if sales average the Q1 rate all year, Total sales would be up about 6% from 2012.
• Construction Spending increased in February
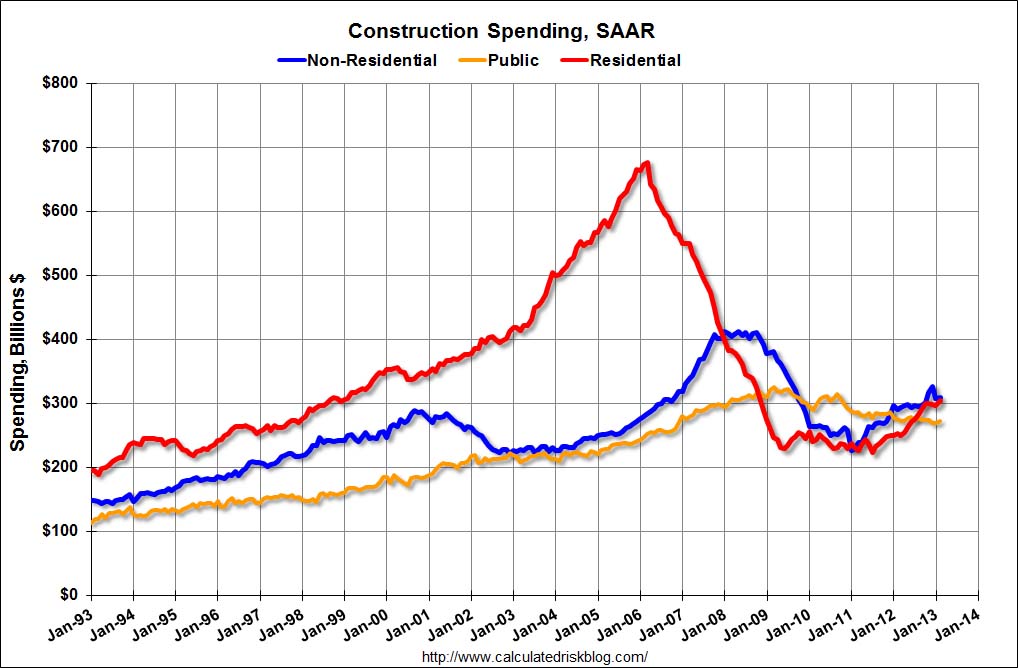 From Census Bureau: “The U.S. Census Bureau of the Department of Commerce announced today that construction spending during February 2013 was estimated at a seasonally adjusted annual rate of $885.1 billion, 1.2 percent above the revised January estimate of $874.8 billion. The February figure is 7.9 percent above the February 2012 estimate of $820.7 billion.”
This graph shows private residential and nonresidential construction spending, and public spending, since 1993. Note: nominal dollars, not inflation adjusted.
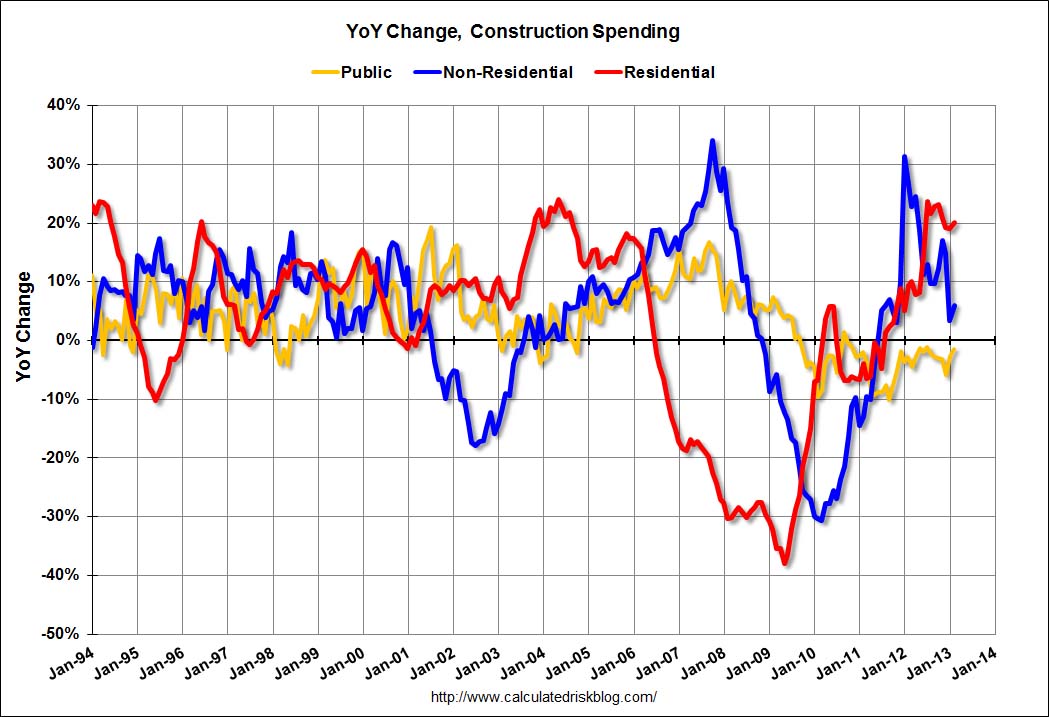 Private residential spending is 55% below the peak in early 2006, and up 36% from the post-bubble low. Non-residential spending is 25% below the peak in January 2008, and up about 37% from the recent low.
Public construction spending is now 16% below the peak in March 2009 and just above the lowest level since 2006 (not inflation adjusted).
The second graph shows the year-over-year change in construction spending.
On a year-over-year basis, private residential construction spending is now up 20%. Non-residential spending is up 6% year-over-year mostly due to energy spending (power and electric). Public spending is down 1.5% year-over-year.
• Trade Deficit declined in February to $43 Billion
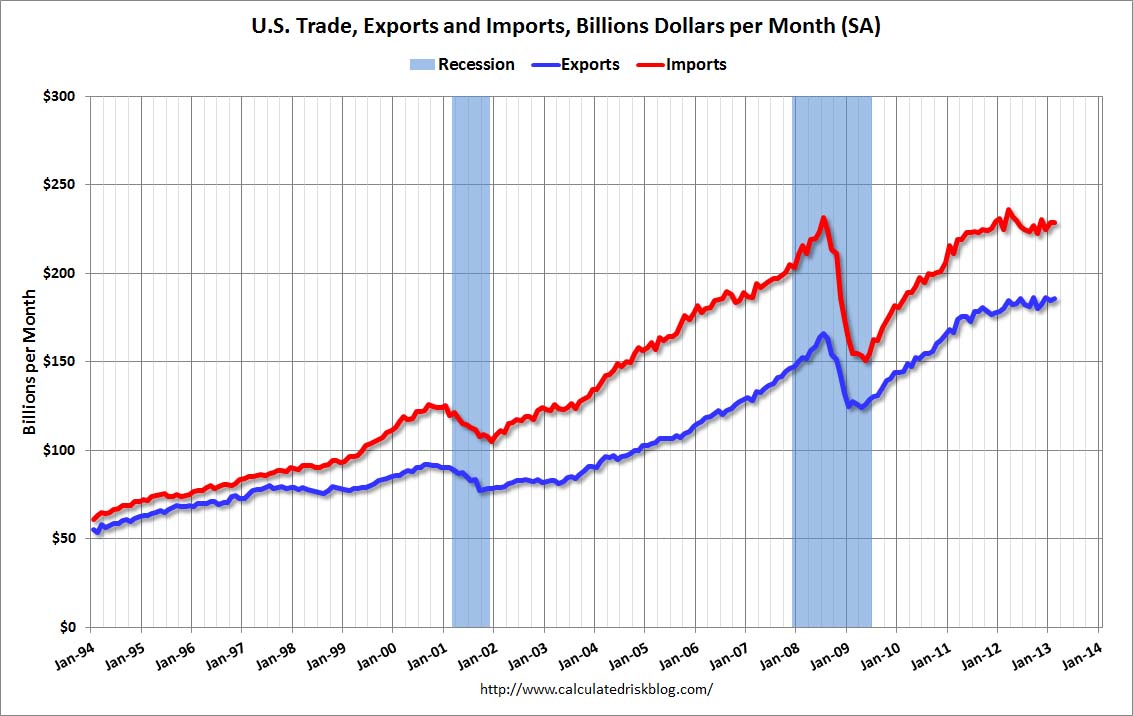 The Department of Commerce reported: “[T]otal February exports of $186.0 billion and imports of $228.9 billion resulted in a goods and services deficit of $43.0 billion, down from $44.5 billion in January, revised. February exports were $1.6 billion more than January exports of $184.4 billion. February imports were $0.1 billion more than January imports of $228.9 billion.”
The trade deficit was below the consensus forecast of $44.8 billion.
Exports are 12% above the pre-recession peak and up 3.2% compared to February 2012; imports are slightly below the pre-recession peak, and up 2% compared to February 2012.
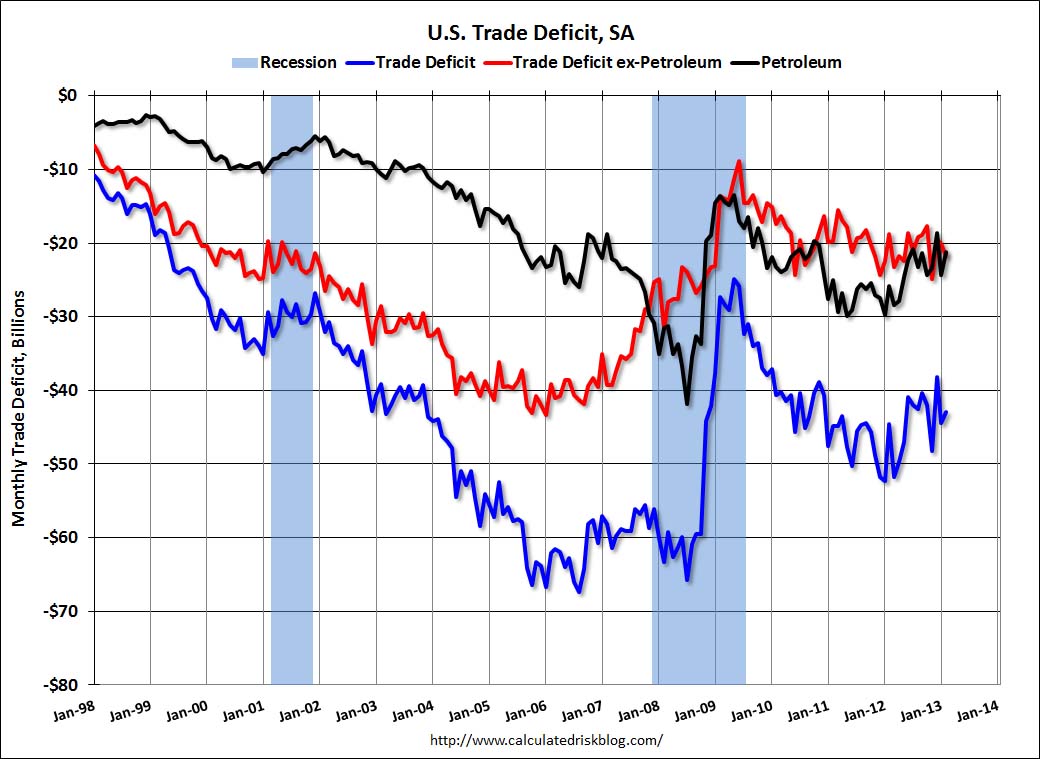 This graph shows the U.S. trade deficit, with and without petroleum, through February.
The blue line is the total deficit, and the black line is the petroleum deficit, and the red line is the trade deficit ex-petroleum products.
The decrease in the trade deficit in February was mostly due to a decrease in the volume of petroleum imports.
Oil averaged $95.96 per barrel in February, up from $94.08 in January, but down from $103.63 in February 2012.
• Weekly Initial Unemployment Claims increase to 385,000
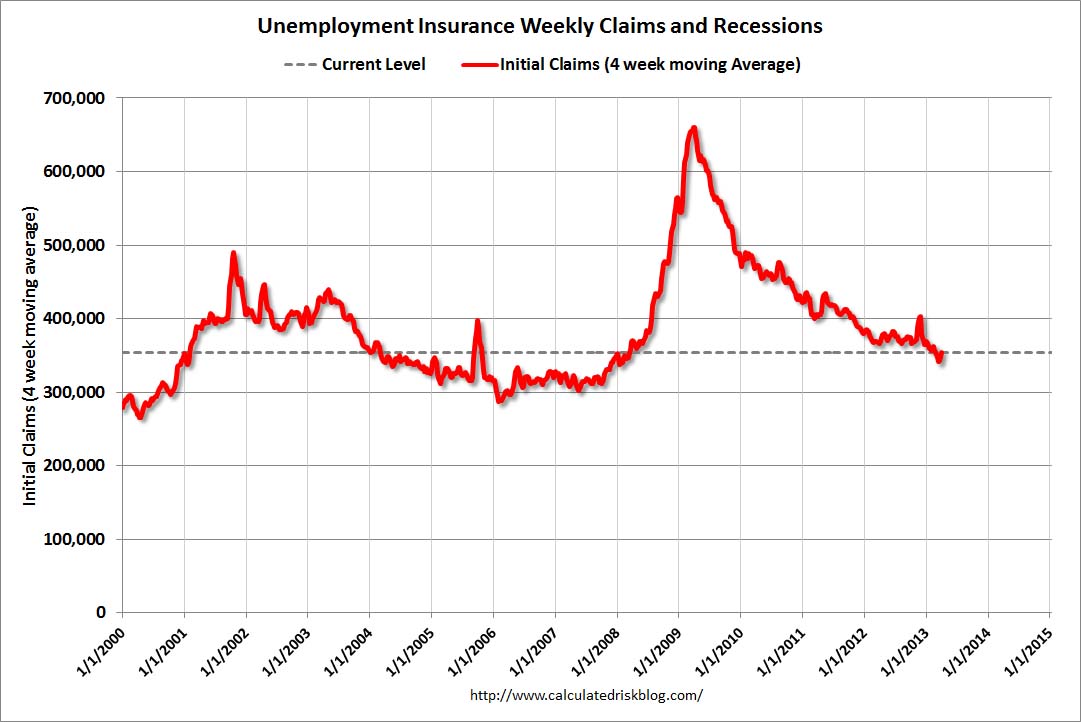 From the DOL: “In the week ending March 30, the advance figure for seasonally adjusted initial claims was 385,000, an increase of 28,000 from the previous week’s unrevised figure of 357,000.”
The dashed line on the graph is the current 4-week average. The four-week average of weekly unemployment claims increased to 354,250 – the highest level since February.
Weekly claims were above the 350,000 consensus forecast. Note: This appears to be the beginning of the impact of the “sequestration” budget cuts.