There was some disappointing data released last week. First quarter real GDP only increased at a 2.5% annual rate, durable goods orders fell more than expected, and most of the manufacturing data (regional surveys, flash PMI) were weak.
However, some of the underlying GDP details were decent (but not great). Final demand increased in Q1 as personal consumption expenditures (PCE) increased at a 3.2% annual rate (up from 1.8% in Q4 2012), and residential investment (RI) increased at a 12.6% annual rate (down from 17.6% in Q4). This was the strongest private domestic contribution (PCE and RI) since Q4 2010, and the 2nd strongest quarter since the recession began.
Unfortunately I expect PCE to slow over the next couple of quarters due to a combination of the payroll tax increase and the sequester budget cuts.
There was also some good news. The new home sales report for March indicated an ongoing recovery for housing, and the existing home sales report suggested an improving market (more conventional sales, fewer distressed sales). Also on housing, LPS reported that the number of non-current mortgages fell below 5 million for the first time since 2008.
Other good news included a drop in initial weekly unemployment claims, and increasing demand for architectural design services (a leading indicator for commercial real estate).
Overall this suggests sluggish growth.
Here is a summary of last week in graphs:
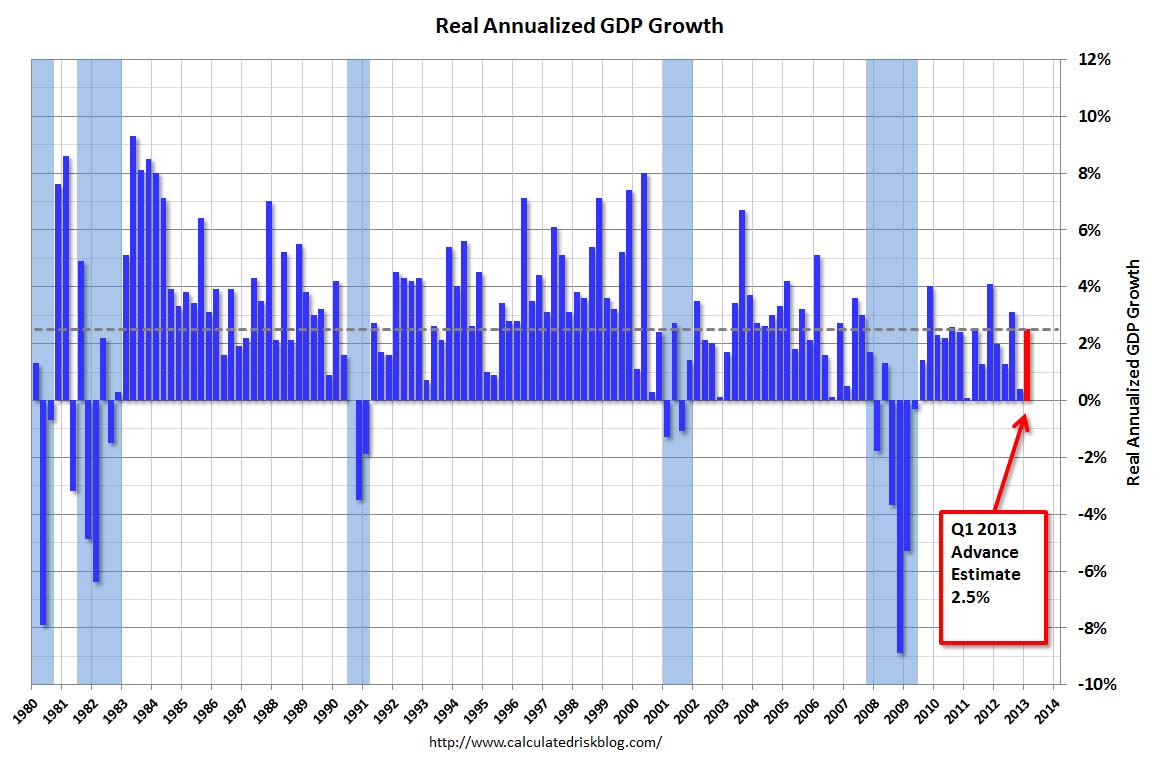
• Real GDP increased 2.5% Annualized in Q1
 Click on graph for larger image.
The BEA reported that “real gross domestic product increased at an annual rate of 2.5 percent in the first quarter of 2013”. This graph shows the quarterly GDP growth (at an annual rate) for the last 30 years.
The Red column (and dashed line) is the advance estimate for Q1 GDP.
The second graph shows the contribution to percent change in GDP for residential investment and state and local governments since 2005.
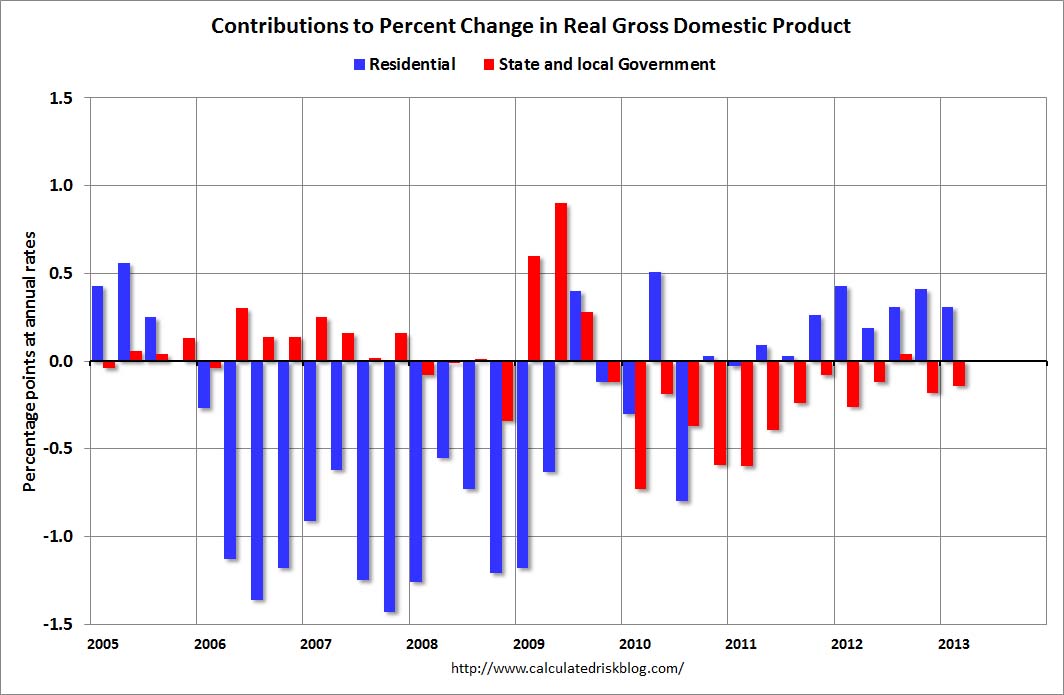 The blue bars are for residential investment (RI), and RI was a significant drag on GDP for several years. Now RI has added to GDP growth for the last 8 quarters (through Q1 2013).
However the drag from state and local governments is ongoing. I was expecting the drag from state and local governments to end, but this unprecedented and relentless decline in state and local government spending is still a drag on the economy. The good news is the drag has to end soon – in real terms, state and local government spending is back to early 2001 levels.
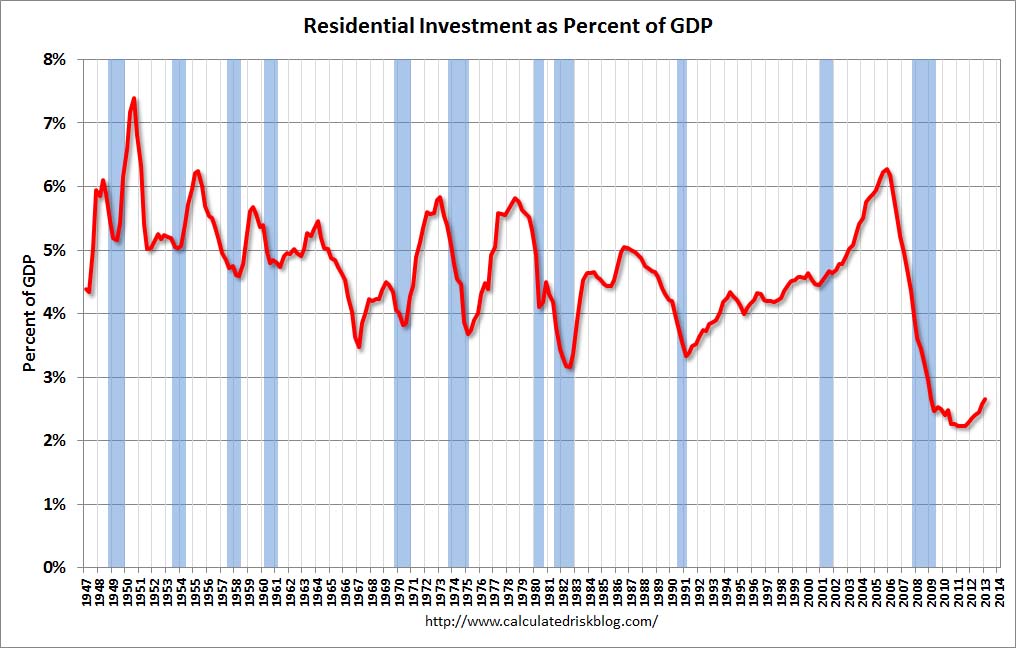 Residential Investment as a percent of GDP is up from the record lows during the housing bust. Usually RI bounces back quickly following a recession, but this time there is a wide bottom because of the excess supply of existing vacant housing units. Clearly RI has bottomed, but it still below the levels of previous recessions.
Overall this was a mediocre report and below expectations, mostly due to government spending and trade. The increase in PCE and RI were positives, but the ongoing government budget cuts continue to slow the economy.
• New Home Sales at 417,000 SAAR in March
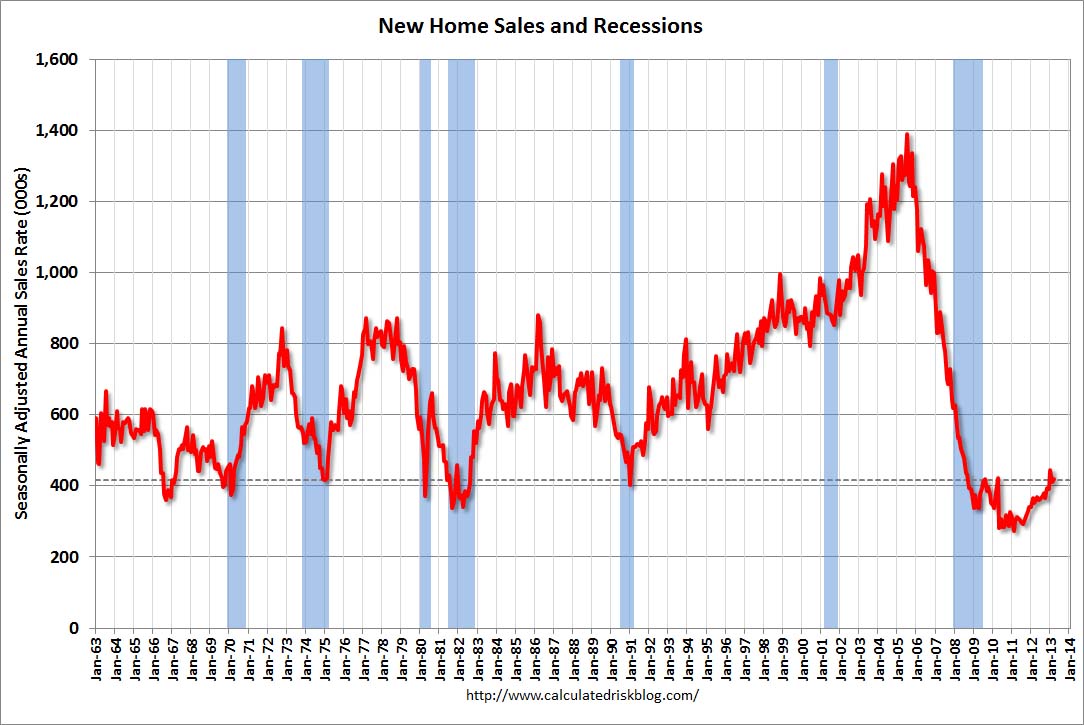 The Census Bureau reports New Home Sales in March were at a seasonally adjusted annual rate (SAAR) of 417 thousand. This was up from 411 thousand SAAR in February.
The first graph shows New Home Sales vs. recessions since 1963. The dashed line is the current sales rate.
On inventory, according to the Census Bureau:
“A house is considered for sale when a permit to build has been issued in permit-issuing places or work has begun on the footings or foundation in nonpermit areas and a sales contract has not been signed nor a deposit accepted.”
Starting in 1973 the Census Bureau broke this down into three categories: Not Started, Under Construction, and Completed.
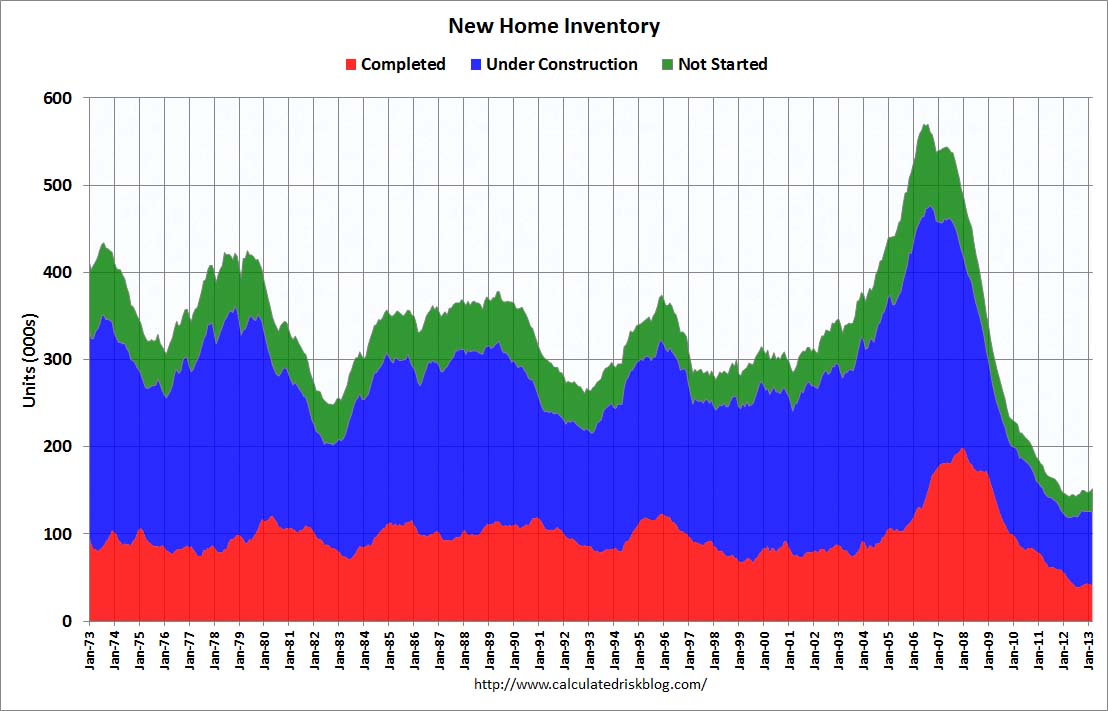 This graph shows the three categories of inventory starting in 1973.
The inventory of completed homes for sale is just above the record low. The combined total of completed and under construction is also just above the record low.
This was at expectations of 419,000 sales in March, and a fairly solid report.
• Existing Home Sales in March: 4.92 million SAAR, 4.7 months of supply
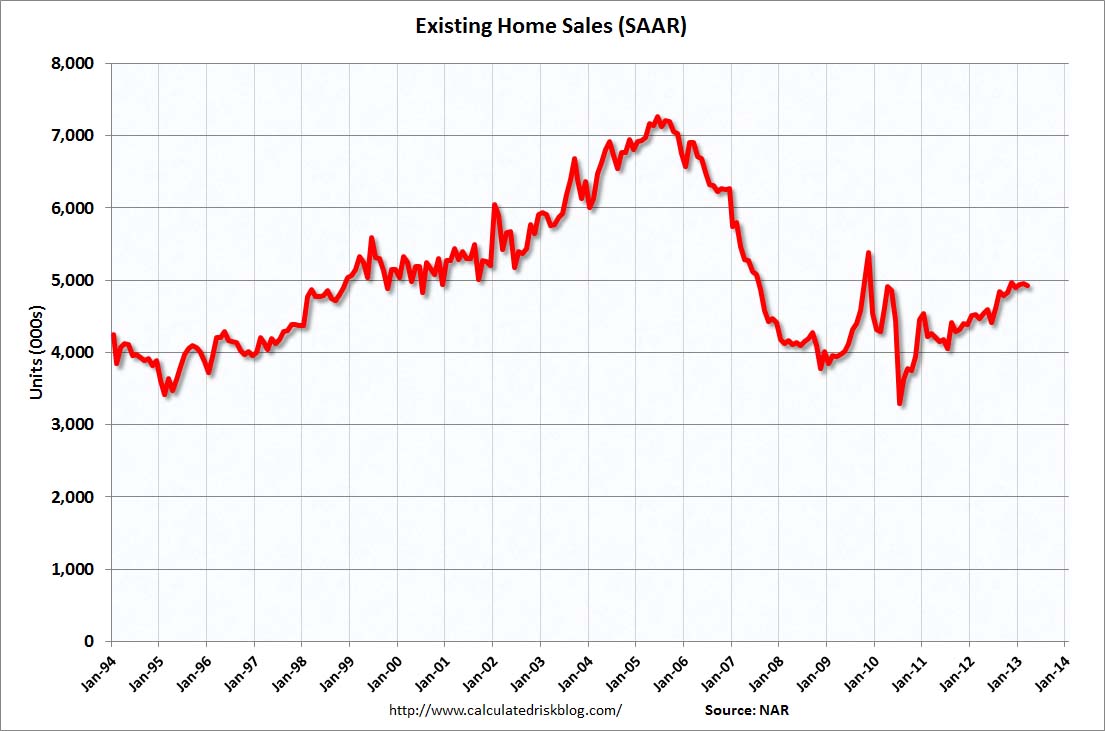 The NAR reports: March Existing-Home Sales Slip Due to Limited Inventory, Prices Maintain Uptrend
This graph shows existing home sales, on a Seasonally Adjusted Annual Rate (SAAR) basis since 1993.
Sales in March 2013 (4.92 million SAAR) were 0.6% lower than last month, and were 10.3% above the March 2012 rate.
The second graph shows the year-over-year (YoY) change in reported existing home inventory and months-of-supply. Since inventory is not seasonally adjusted, it really helps to look at the YoY change. Note: Months-of-supply is based on the seasonally adjusted sales and not seasonally adjusted inventory.
 Inventory decreased 16.8% year-over-year in March compared to March 2012. This is the 25th consecutive month with a YoY decrease in inventory, but the smallest YoY decrease since 2011 (I expect the YoY decrease to get smaller all year).
Months of supply increased to 4.7 months in March.
This was below expectations of sales of 5.03 million, but close to Tom Lawler’s forecast. For existing home sales, the key number is inventory – and the sharp year-over-year decline in inventory is a positive for housing. Overall his was a solid report.
• AIA: Architecture Billings Index indicates increasing demand for design services in March
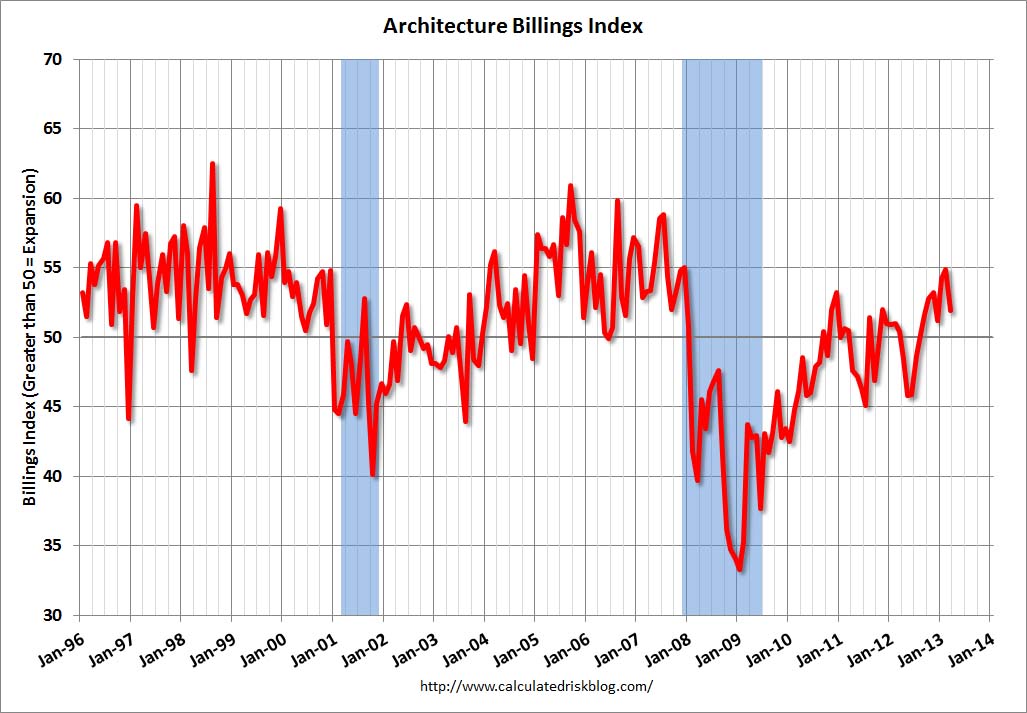 Note: This index is a leading indicator primarily for new Commercial Real Estate (CRE) investment.
From AIA: More Positive Momentum for Architecture Billings
This graph shows the Architecture Billings Index since 1996. The index was at 51.9 in February, down from 54.9 in February. Anything above 50 indicates expansion in demand for architects’ services, and this was the eight consecutive month with a reading above 50.
Every building sector is now expanding and new project inquiries are strongly positive (down from February, but still at 60.1). Note: This includes commercial and industrial facilities like hotels and office buildings, multi-family residential, as well as schools, hospitals and other institutions.
According to the AIA, there is an “approximate nine to twelve month lag time between architecture billings and construction spending” on non-residential construction. This index suggests some increase in CRE investment in the second half of 2013.
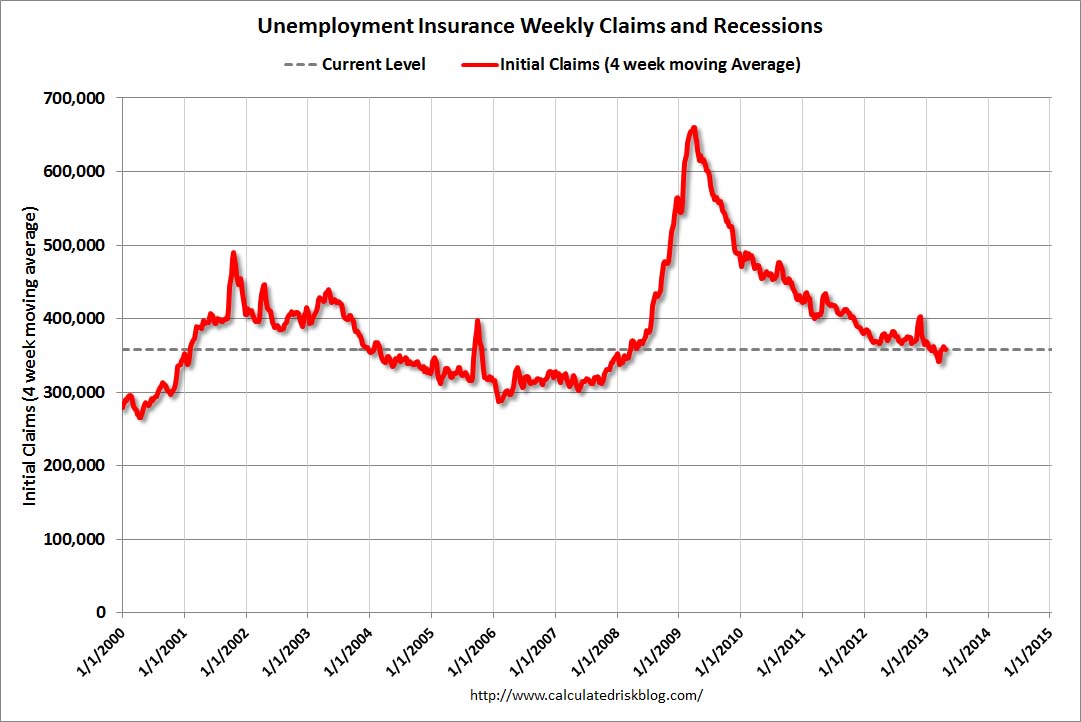
• Weekly Initial Unemployment Claims decline to 339,000
 The DOL reports:
In the week ending April 20, the advance figure for seasonally adjusted initial claims was 339,000, a decrease of 16,000 from the previous week’s revised figure of 355,000. The 4-week moving average was 357,500, a decrease of 4,500 from the previous week’s revised average of 362,000.
The dashed line on the graph is the current 4-week average. The four-week average of weekly unemployment claims decreased to 357,500.
Weekly claims were the lowest in six weeks and were below the 350,000 consensus forecast.
• Final April Consumer Sentiment increases to 76.4
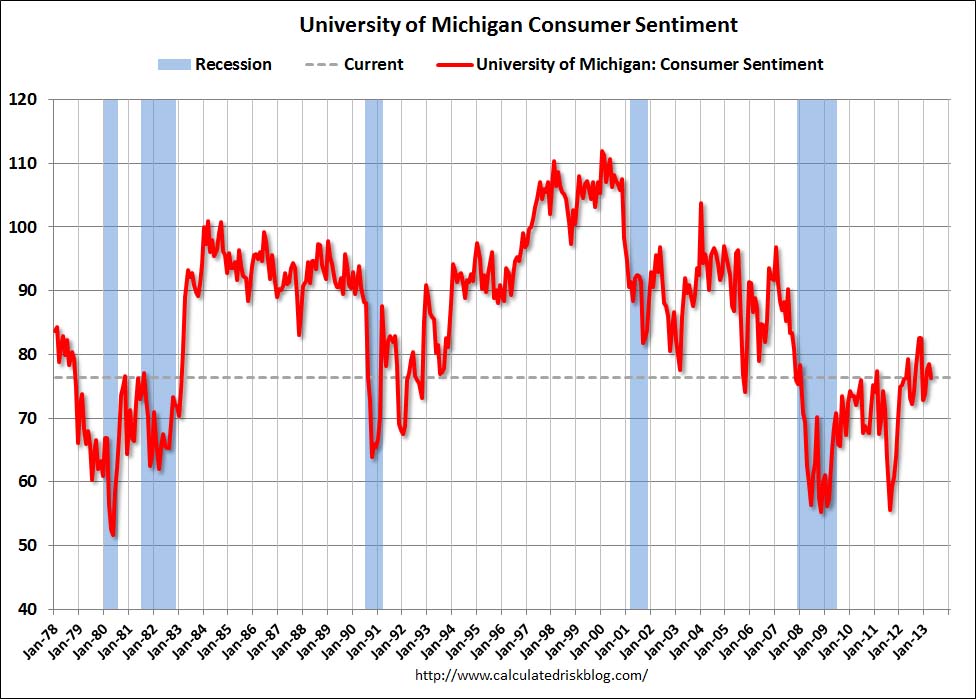 The final Reuters / University of Michigan consumer sentiment index for April increased to 76.4 from the preliminary reading of 72.3, but down from the March reading of 78.6.
This was above the consensus forecast of 73.0, but still fairly low. There are a number of factors that impact sentiment including unemployment, gasoline prices and, for 2013, the payroll tax increase and even politics (sequestration, etc).
Sentiment is mostly moving sideways over the last year at a fairly low level (with ups and downs).