Here is a price index for commercial real estate that I follow.
From CoStar: Annual Pricing Gains Seen Across All Regions and Property Types Despite Seasonal Slowdown in First Quarter 2013
PRICING RECOVERY SLUGGISH IN THE FIRST QUARTER: The two broadest measures of aggregate pricing for commercial properties within the CCRSI—the value-weighted U.S. Composite Index and the equal-weighted U.S. Composite Index—were slightly negative in March 2013, a continuation of a seasonal pattern witnessed in the last several years which contributed to modest declines in the first quarter. Despite the uneven first quarter performance, commercial real estate prices are still up appreciably from year ago levels. The equal-weighted index, which reflects more numerous smaller transactions, increased 5.7% from March 2012, while the value-weighted index, which is influenced by larger transactions, expanded by 8.1% during the same period.
SEASONALITY CONTINUES TO BE EVIDENT IN THE COMMERCIAL REAL ESTATE MARKET: In each of the past four years, a pricing decline in the first quarter has been preceded by a similar pricing increase in the last quarter of the previous year. These year-end spikes have been consistent with elevated transaction volume as investors rush to close deals, while the first-quarter declines have coincided with a return to more typical trading activity. This volatility is a normal and expected occurrence and should not be interpreted as a regression in real estate prices.
DISTRESS SALES DECLINE: The percentage of commercial property selling at distressed prices dropped to 16.4% in March 2013 from 25.5% in March 2012.
emphasis added
 Click on graph for larger image.
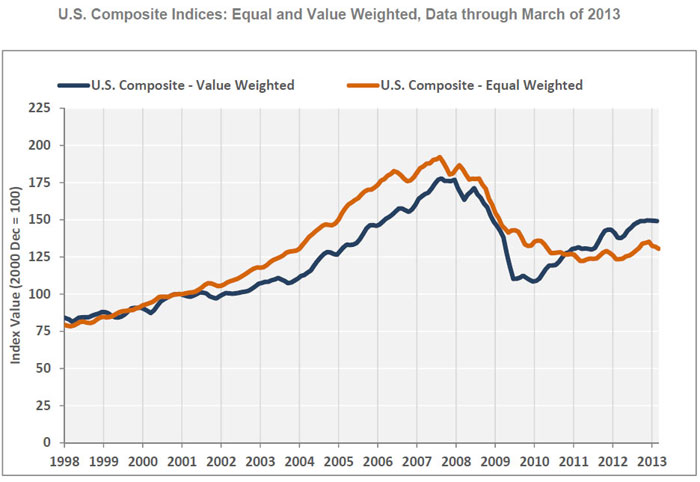
This graph from CoStar shows the Value-Weighted and Equal-Weighted indexes. CoStar reported that the Value-Weighted index is up 37.5% from the bottom (showing the demand for higher end properties) and up 8.1% year-over-year. However the Equal-Weighted index is only up 6.8% from the bottom, and up 5.7% year-over-year.
Note: These are repeat sales indexes – like Case-Shiller for residential – but this is based on far fewer pairs.