Theoretically, capital income, especially in the form of retained earnings by corporations and some capital gains would be used for saving and investment in the means of production, while labor income is used for consumption of finished goods and services from production. However, a portion of capital income is used for consumption, when the incentives and extra liquidity are there.
What is the percentage of capital income that is used for consumption of finished goods and services? And is it helpful to know?
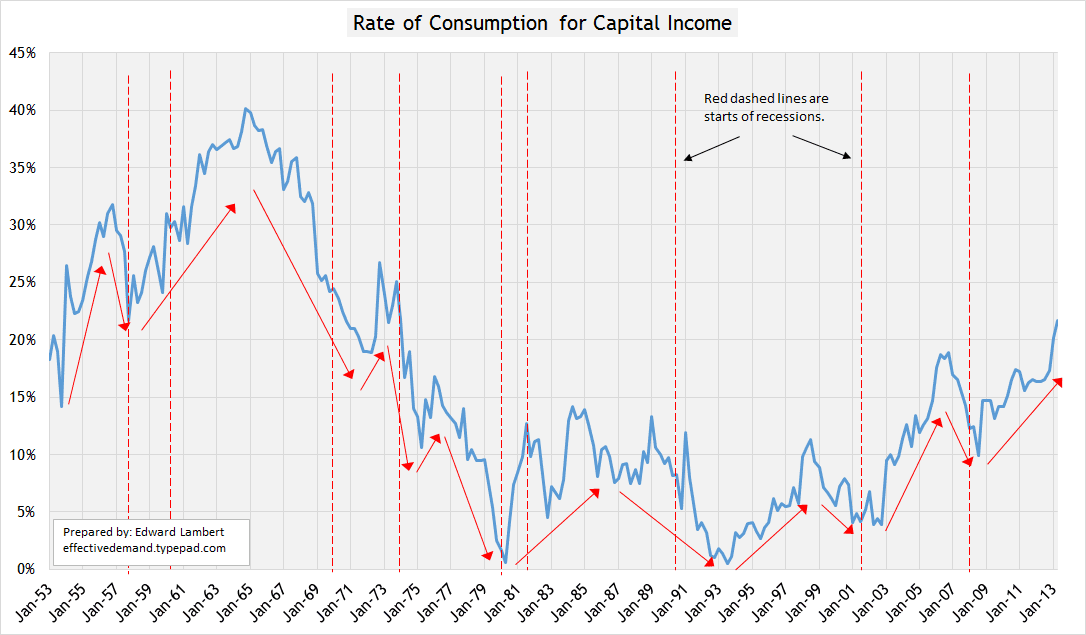
Here is the graph I put together showing the changes in the consumption rate of capital income since 1953…
The consumption rate of capital income reached 40% in the 1960s and then fell to almost 0% during the 1980 recession. Why the dramatic drop? And if we look to 2013, we see that the rate is making a comeback.
What could be going on here?
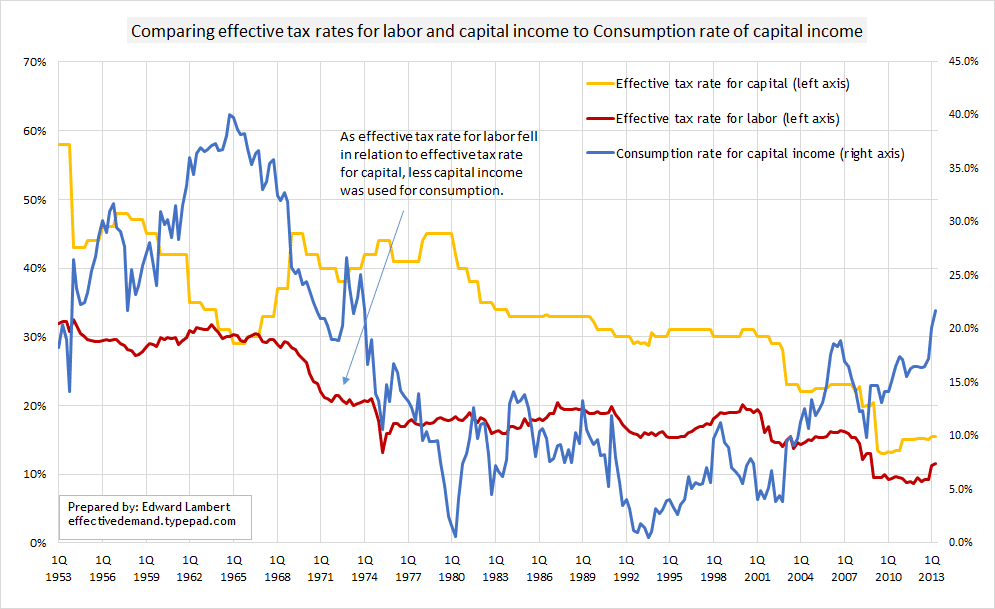
Well, as I inputted decades of data using dozens of sheets of paper, patterns appear. One clear pattern is the effect of tax rates. In the following graph I show the effective tax rates for capital income and for labor income. These are the effective tax rates used to determine the data in graph #1 along with the national income account numbers. (source for effective tax rates on capital income.) (source for national income account data.)
The main thing to look at in graph #2 is the spread between the effective tax rate for capital income (yellow line using left axis) and the effective tax rate for labor income (red line using left axis). A general rule is that a wider spread will decrease capital income’s consumption rate.
As the effective tax rate for capital income fell in the 1950s to 1960s, more capital income was used for consumption purposes, because we see the rate for capital consumption rise and reach a peak at 40% in 1965. (Capital income consumption is the blue line using the right axis.)
Then in 1967, the effective tax rate for capital income began to rise, while the effective tax rate for labor income began to fall. It became cheaper to use labor income for consumption. The result was a fall in capital income’s consumption rate. The fall continued all the way to almost 0% during the 1980 recession. There was a rise in the effective tax rate on capital income around 1978 which looks to have contributed to pushing capital income’s consumption rate down further. When the consumption rate hit its low, the effective tax rate for capital income started dropping. The “writing must have been on the wall” that the effective tax rate on capital income was too much. The result was that the consumption rate of capital income bounced back to almost 15% by 1985.
Since 2003, the consumption rate for capital income has been rising. We see that the effective tax rate on capital income has been falling since 2003 too. The effective tax rate on labor income has been falling too, but the spread has narrowed which makes using capital income for consumption marginally cheaper.
On another note: There is an interesting thing in graph #1… The recessions since 1970 (taking out the Volcker induced recession of 1981) were preceded by the consumption rate of capital income falling. The implication is that one can foresee a recession by watching this rate.
There is a reason why capital income’s consumption rate could foretell a recession.
Leading up to a recession, profit rates will peak and then back-off. As this happens, more capital income is retained by the corporation and other capital entities for their protection. The result is progressively less funds permitted for consumption.
It looks as though the consumption rate of capital income will decline for at least a year before a recession. Graph #1 shows that the consumption rate of capital income is still rising in 2nd quarter 2013, which means that a recession is not yet on the horizon.
Cross-posted at effectivedemand.typepad.com

