Nick Rowe from the blog Worthwhile Canadian Initiative asked a very good question on August 30th… “How can you get an economy INTO a liquidity trap?”
He goes through some scenarios that would put an economy in a liquidity trap … and then shows that a reversal in monetary policy could pull the economy out of the liquidity trap. He then presents an idea for inflation inertia that could put an economy into the trap, and it would be hard for monetary policy to pull an economy out.
He finishes his post by saying… “It might be possible to get an economy irreversibly stuck in a liquidity trap. But it’s a lot harder than you might think.”
Well, it is not really that hard to put an economy into a liquidity trap from which it cannot escape. Basically, you lower labor share of income below a certain threshold et Voilá… you are stuck in a long-term liquidity trap, irregardless of monetary policy.
Let me show how this happens… (source)
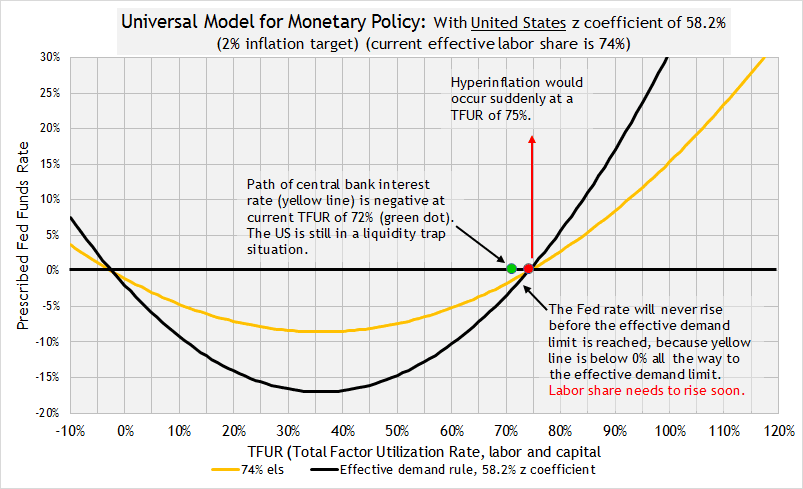
On the y-axis we see the prescribed central bank interest rate. On the x-axis we see a value called the TFUR, which is simply multiplying the capital utilization rate by the labor utilization rate. The TFUR gives a measure of a total utilization rate for the factors of production, namely labor and capital.
This graph shows the paths of a central bank interest rate based upon the utilization of the factors of production. Each path is determined by the labor share of income. So the blue line uses a higher labor share of income than the yellow line. The orange line below uses the lowest labor share measure. As you move from lower to higher labor share, the prescribed central bank interest rate would rise in response. Thus, as labor share falls, the corresponding central bank interest rate would fall too.
The equation for the prescribed interest rate path is…
Prescribed Fed rate = z * (TFUR2 + els2) – (1 – z) * (TFUR + els) – inflation target
z = the coefficient of the equation which corresponds to the labor share anchor… els = effective labor share which is a measure of labor share that determines the effective demand limit.
To get stuck in a liquidity trap, the path of the prescribed central bank interest rate would have to fall to a level below the zero lower bound. You will notice that all the paths will eventually rise to the right above the 0% lower bound. However, the black line with the green dots is the effective demand limit. The TFUR, according to data since 1967 for the US, will not go much beyond the effective demand limit (black line).
Effective demand limit = 2 * z * TFUR2 – 2 * (1 – z) * TFUR – inflation target
So if a path goes positive to the right of the black line, or better yet, passes below the red dot, the central bank interest rate will get stuck on the red dot, the crossing point between the zero lower bound and the effective demand limit. For example, the yellow line goes positive at a TFUR around 78%. The effective demand limit is at a TFUR of 74%. Thus, the economy will not reach a low enough unemployment rate or high enough capital utilization rate to bring the central bank interest back into positive territory.
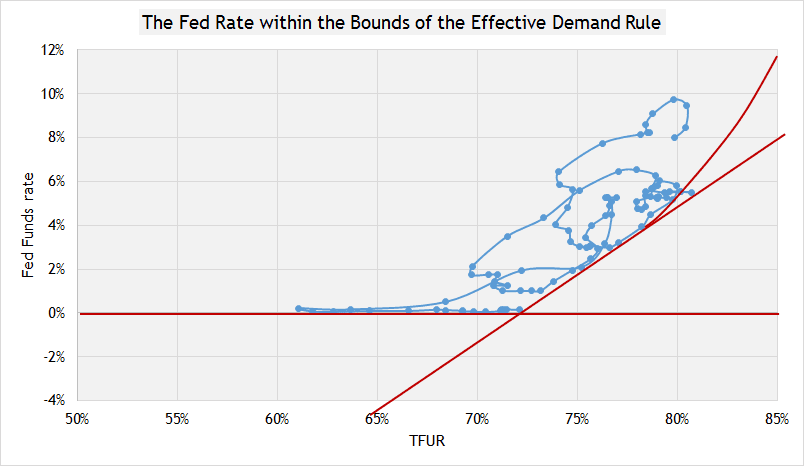
How well does this graph match actual data? Here is a graph using actual quarterly data since 1988 for the US Fed rate…
You can see the Fed rate moving along the zero lower bound all the way to a TFUR of 72%. The TFUR is currently around 72% and the Fed rate is still at 0%. Do you see the point where the zero lower bound and the diagonal line meet? That point is shaping up to be the lockout point, which means the economy is stuck below the zero lower bound. The Fed rate can get stuck at the zero lower bound due to a low labor share of income. The diagonal line is based on labor share.
Graph #3 shows the current situation in the US where the effective labor share is holding steady around 74% after falling 5% since the crisis. So the path of the Fed rate has fallen from above the red dot to below the it, since the crisis. The Fed probably did not see that coming.
The path of the Fed rate goes along the yellow line. We can see that the yellow line passes just below the red dot, but not above it. The result is that the US Fed rate is stuck on the zero lower bound of the liquidity trap no matter what US monetary policy does.
What is the basic mechanism of the effective demand limit? The amount labor is paid determines a limit upon utilization of labor and capital. What business gives to labor sets a limit on production… and the limit says that the product of the utilization rates of labor and capital will not go above the effective rate of sharing income with labor.
Effective demand limit …
Effective labor share – (capital utilization rate * labor utilization rate) > 0
How do you get an economy stuck in a liquidity trap where monetary policy won’t work to get it out. It’s as easy as apple pie. Just lower labor’s share of national income. How do you like them apples?
Welcome to the new economic paradigm.


