In addition to Case-Shiller, CoreLogic, FHFA and LPS, I’m also watching the FNC, Zillow and several other house price indexes.
From FNC: FNC Index: Home Prices Up 0.6% in August; Signs of Subsiding Growth Momentum
The latest FNC Residential Price Index™ (RPI) shows continued growth of home prices in August as the U.S. housing recovery remains well underway. The index moved 0.6% higher from the previous the month, making August the 18th consecutive month of rising home prices. According to the FNC RPI, August home prices have climbed to the levels attained in December 2009. …
In August, foreclosure sales nationwide accounted for 12.4% of total home sales, down slightly from July’s 12.7% and by more than 4.5 percentage points from a year ago. However, there are signs that the price momentum has likely subsided entering the fall/winter low season in homebuying. The latest September median sales-to-list price ratio edged lower to 96.2 – a 3.8% listing price markdown among closed sales, down from 97.2 in August. …
Based on recorded sales of non-distressed properties (existing and new homes) in the 100 largest metropolitan areas, the FNC 100-MSA composite index shows that August home prices increased from the previous month at a seasonally unadjusted rate of 0.6%. In a sign of moderating month-over-month price momentum, August’s price increase is smaller than June and July. On a year-over-year basis, home prices were up a modest 5.3% from a year ago. The two narrower indices exhibit similar month-over-month price momentums but a slightly faster year-over-year price increase.
…
FNC’s RPI is the mortgage industry’s first hedonic price index built on a comprehensive database that blends public records of residential sales prices with real-time appraisals of property and neighborhood attributes. As a gauge of underlying home values, the RPI excludes sales of foreclosed homes, which are frequently sold with large price discounts, reflecting poor property conditions.
emphasis added
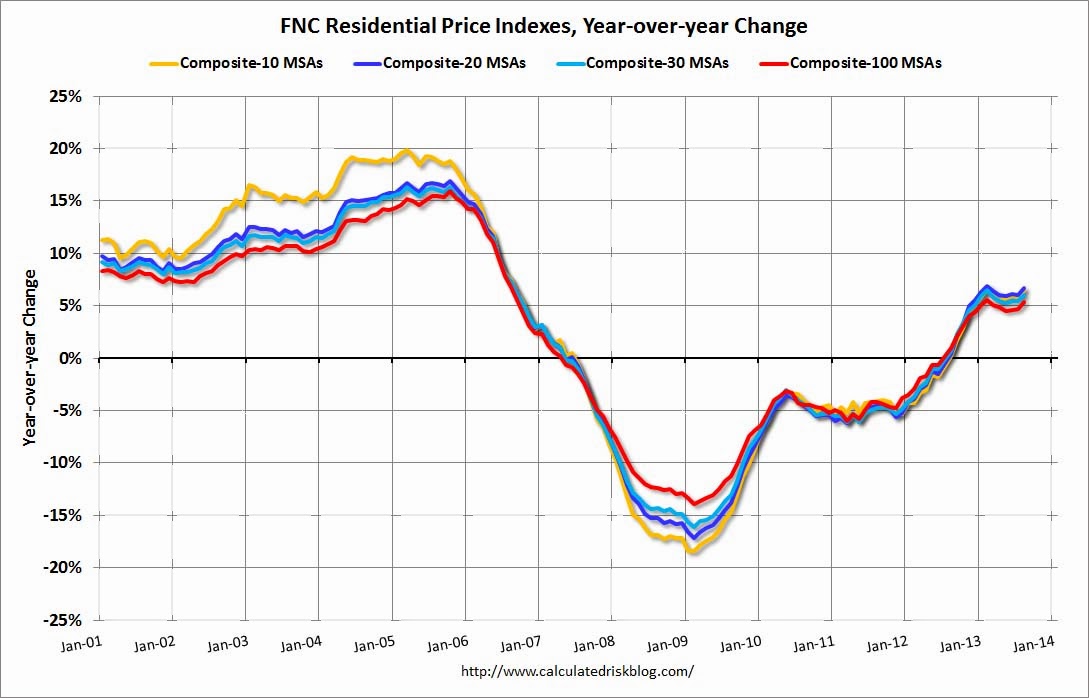
The 100-MSA composite was up 5.3% compared to August 2012 (slightly higher YoY change than in June and July). The FNC index turned positive on a year-over-year basis in July, 2012.
 Click on graph for larger image.
This graph shows the year-over-year change for the FNC Composite 10, 20, 30 and 100 indexes.
Even with the recent increase, the FNC composite 100 index is still off 26.2% from the peak.
I expect all of the housing price indexes to show lower year-over-year price gains toward the end of this year.