This monthly decline appears weather related since miles driven were down 4.6% in the Northeast, and 4.0% in the Northwest. Miles driven were up 2.9% in the West.
The Department of Transportation (DOT) reported:
Travel on all roads and streets changed by -1.3% (-2.9 billion vehicle miles) for January 2014 as compared with January 2013.
…
Travel for the month is estimated to be 224.0 billion vehicle miles.
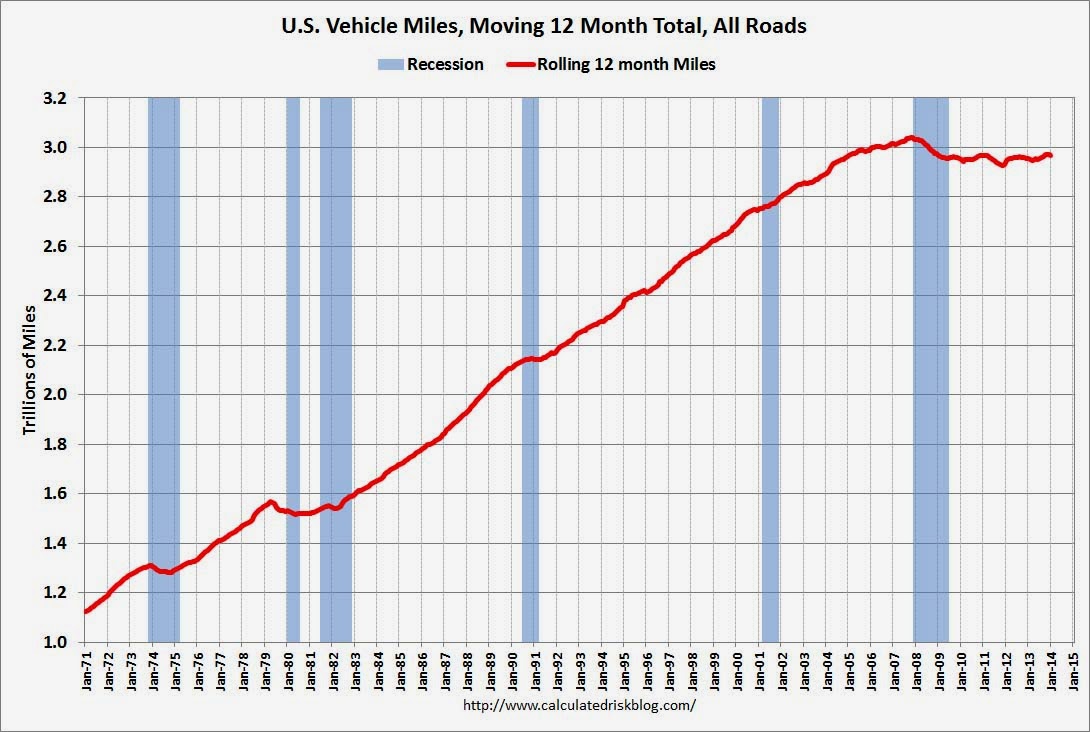
The following graph shows the rolling 12 month total vehicle miles driven.
The rolling 12 month total is still mostly moving sideways but has started to increase a little recently.
 Click on graph for larger image.
In the early ’80s, miles driven (rolling 12 months) stayed below the previous peak for 39 months.
Currently miles driven has been below the previous peak for 74 months – 6+ years – and still counting. Currently miles driven (rolling 12 months) are about 2.3% below the previous peak.
The second graph shows the year-over-year change from the same month in the previous year.
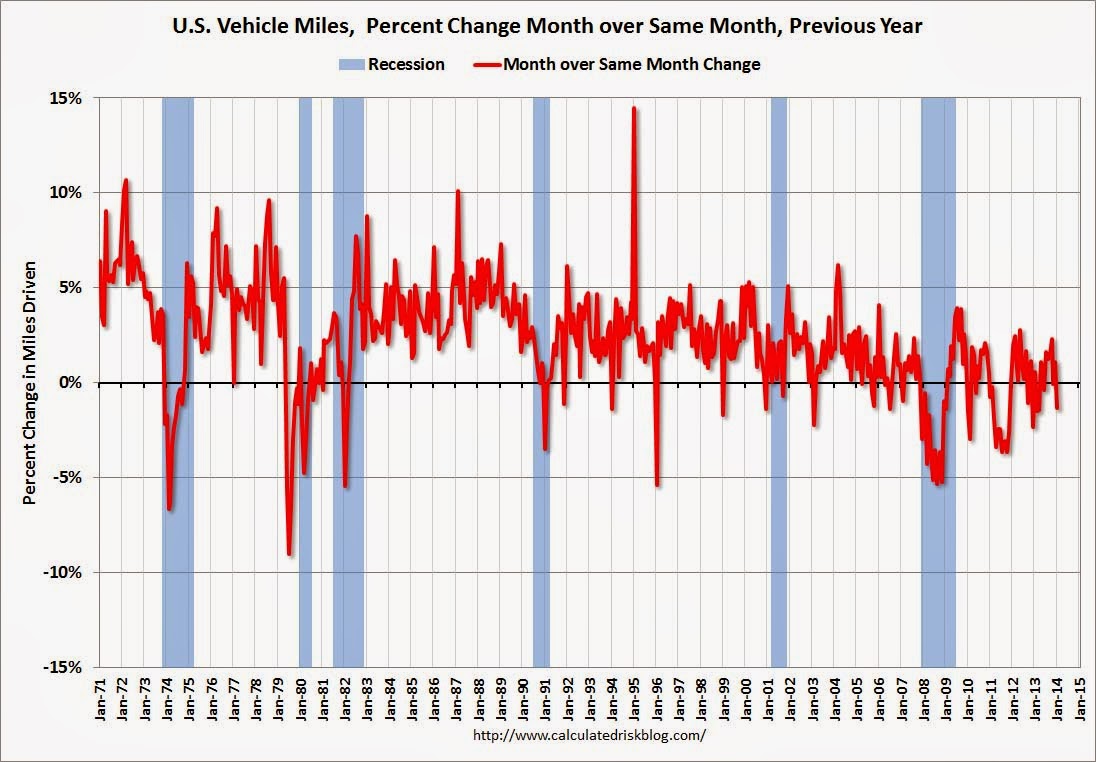 In January 2014, gasoline averaged of $3.39 per gallon according to the EIA. that was unchanged from January 2013 when prices also averaged $3.39 per gallon.
As we’ve discussed, gasoline prices are just part of the story. The lack of growth in miles driven over the last 6 years is probably also due to the lingering effects of the great recession (high unemployment rate and lack of wage growth), the aging of the overall population (over 55 drivers drive fewer miles) and changing driving habits of young drivers.
With all these factors, it might take a few more years before we see a new peak in miles driven – but it appears miles driven might be gradually increasing again.