The Russell 2000 has been taking it on the chin: It’s been the scapegoat for the April sell off and, unlike other indexes, wasn’t able to report new all-time highs in June. Will the Russell 2000 catch up or lead the broad indexes lower?
The Russell 2000 has been the ‘black sheep’ and ‘scapegoat’ of market indexes. Small cap stocks led the April sell, losing as much as 10%, and lagged the May/June rally.
What’s the deal with small caps? Will they catch up or lead the broad market lower?
Here’s what the Russell 2000 (Chicago Options: ^RUT) chart says:

Support
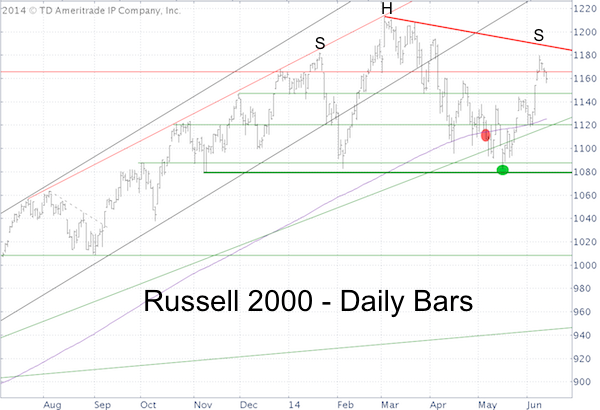
On May 6, the Russell 2000 closed below the 200-day SMA for the first time since November 21, 2012.
The May 7 Profit Radar Report made this observation: “Many investors follow the 200-day SMA. A close below it is generally considered a sell signal and/or bear market. The path of least resistance would be to jump on the sell signal bandwagon, but that’s premature in my humble opinion. The Russell support cluster at 1,100 – 1,080 seems more important than the 200-day SMA at 1,115.”
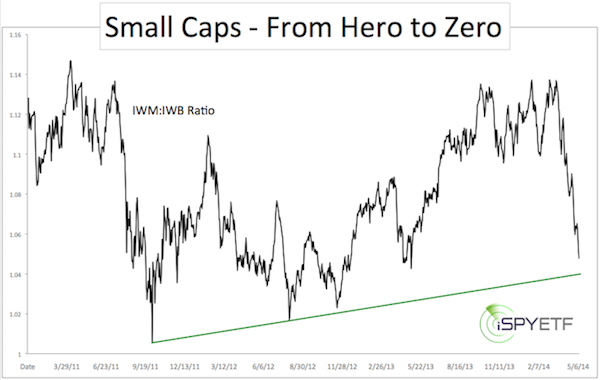
The small cap/large cap ratio (IWM/IWB) chart IWM = iShares Russell 2000 ETF (NYSEArca: IWM), IWM = iShares Russell 1000 ETF (NYSEArca: IWB) – featured in the same Profit Radar Report also suggested that important support is still ahead (chart below).

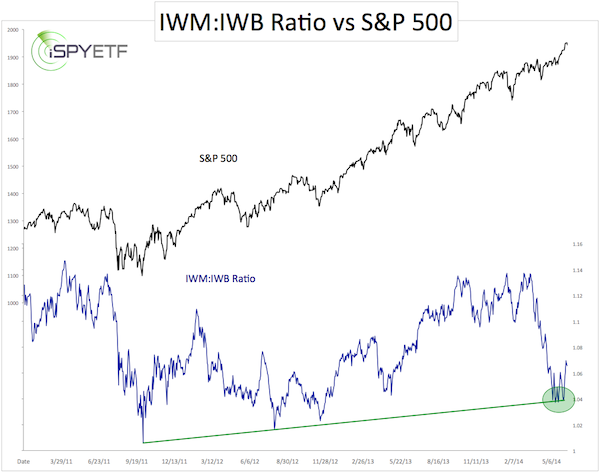
Here is an updated version of the IWM:IWB ratio chart plotted against the S&P 500 (NYSEArca: SPY). Green trend line support held and buoyed small caps and the S&P 500.

Resistance
1,080 is also the neckline of a possible head-and shoulders pattern. The May 11 Profit Radar Report stated that: “The Russell 2000 has kept the possibility of a bearish head-and shoulders pattern alive, as the left and right shoulder sport near-perfect symmetry. The ascending red trend line at 1,188 appears to be the dividing line between bullish and bearish bets.”
Summary
For now the Russell 2000 is trading between support and resistance. The weak IWM:IWB ratio recovery hints at further small cap weakness, but for now there are different ways to play this constellation:
- Sell against resistance
- Buy against support
- Buy once resistance is busted
- Sell once support is broken
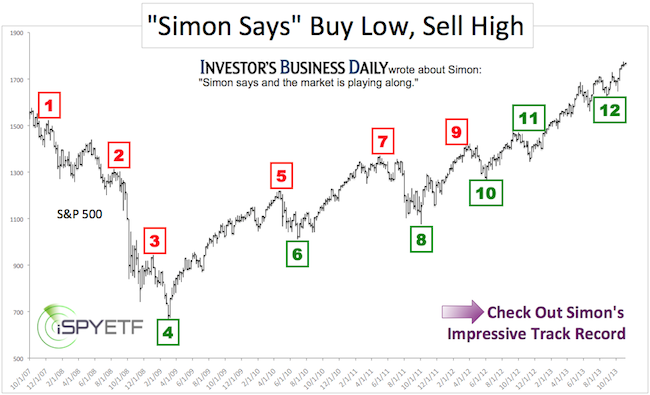
Perhaps even more revealing is the current S&P 500 constellation. The 2014 S&P 500 forecast projected an S&P 500 high around 1,955 in May 2014.
The S&P 500 reached this target in June and peeled back. Does this mean a significant top is near? All the details are available in an update to the original 2014 S&P 500 forecast:
Simon Maierhofer is the publisher of the Profit Radar Report. The Profit Radar Report presents complex market analysis (S&P 500, Dow Jones, gold, silver, euro and bonds) in an easy format. Technical analysis, sentiment indicators, seasonal patterns and common sense are all wrapped up into two or more easy-to-read weekly updates. All Profit Radar Report recommendations resulted in a 59.51% net gain in 2013.
Follow Simon on Twitter @ iSPYETF or sign up for the FREE iSPYETF Newsletter to get actionable ETF trade ideas delivered for free.
