The new home sales report for September was slightly above expectations at 467 thousand on a seasonally adjusted annual rate basis (SAAR). With the downward revision to August sales, sales for September were at the the highest sales rate since July 2008.
Sales for the previous three months (June, July and August) were revised down.
Earlier: New Home Sales increased slightly to 467,000 Annual Rate in September
The Census Bureau reported that new home sales this year, through September, were 338,000, Not seasonally adjusted (NSA). That is up 2.4% from 330,000 during the same period of 2013 (NSA). Not much of a gain from last year. Right now it looks like sales will barely be up this year (maybe 3% or so for the year).
Sales were up 17.0% year-over-year in September – however sales declined sharply in Q3 2013 as mortgage rates increased – so this was an easy comparison. The comparisons for Q4 will be more difficult.
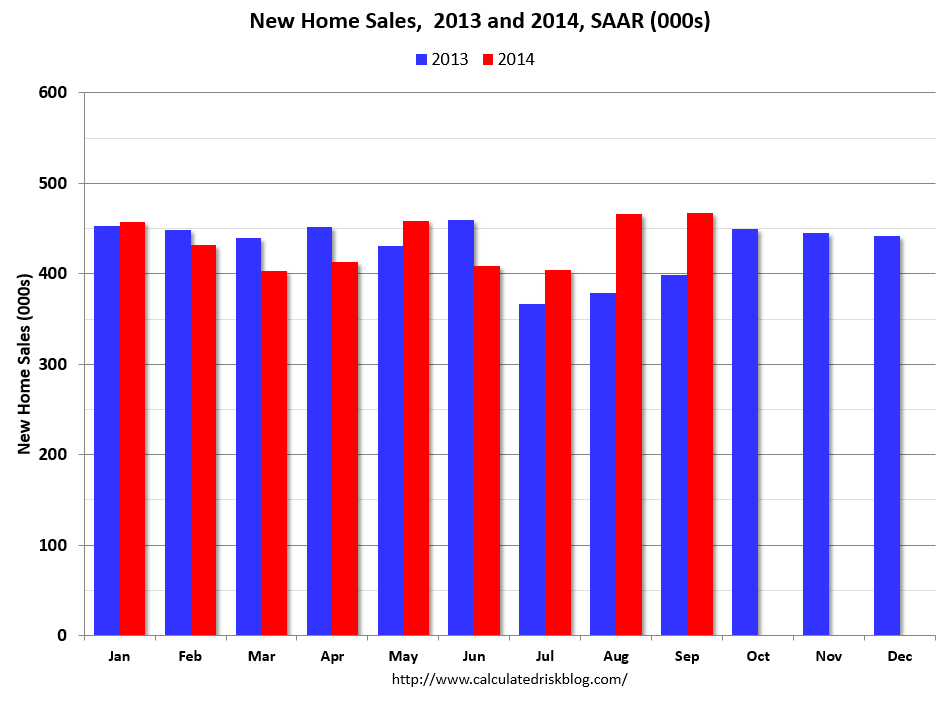 Click on graph for larger image.
This graph shows new home sales for 2013 and 2014 by month (Seasonally Adjusted Annual Rate).
The year-over-year gain will probably be smaller in Q4, but I expect sales to be up for the quarter and for the year.
And here is another update to the ”distressing gap” graph that I first started posting several years ago to show the emerging gap caused by distressed sales. Now I’m looking for the gap to close over the next few years.
 The “distressing gap” graph shows existing home sales (left axis) and new home sales (right axis) through September 2014. This graph starts in 1994, but the relationship has been fairly steady back to the ’60s.
Following the housing bubble and bust, the “distressing gap” appeared mostly because of distressed sales.
I expect existing home sales to mostly move sideways (distressed sales will continue to decline and be somewhat offset by more conventional / equity sales). And I expect this gap to slowly close, mostly from an increase in new home sales.
Note: Existing home sales are counted when transactions are closed, and new home sales are counted when contracts are signed. So the timing of sales is different.