Reader Roger asked me “What is the total number of people without full time work, compared to Jan 2009?“
That’s actually an easy number to calculate. The problem is the number is totally misleading. First let’s answer the question straight up.
Those Not Working Full Time
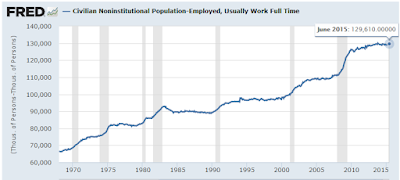
The above very scary-looking chart shows the civilian noninstititional population minus those usually working full time.
Noninstitutional means those over the age of 16, not in prisons, mental institutions, etc.
The current noninstitutional population is 129.61 million. At the beginning of 2009 it was 118.92 million and at the start of the recession in November of 2007 it was 111.06 million.
Since the beginning of the recession, the rise in the number of people not working fulltime is 18.55 million.
Calculation Discussion
The first problem with the above chart is that it fails to account for demographics. There is a huge rise in population as well as huge rise in boomer retirement.
Moreover, over time, there has been a legitimate rise in the number of people going to college after high school graduation.
Brief Word on the Unemployment Rate
As pertains to the much ballyhooed declining unemployment rate, there is also a non-insignificant number of people in college who really would rather be working.
Add to that, millions of people who would rather be working, but are not counted as unemployed because they stopped looking for a job.
That is why many, myself included, believe the unemployment rate is a joke.
Proper Comparison
To properly address Roger’s question, one needs to factor in
- Normal retirement age (say 65)
- Rise in population
- Relative rise in non-fulltime employment vs. the rise in population
The problem in producing the proper calculation is insufficient data. The St. Louis Fed repository (named Fred), that I used to easily create the above chart, does not have the data.
Not even the BLS has the data we need to properly answer the question. Information on the critical age group 55 to 64 is scant or missing.
However, we can look at age group 16-54 or 25-54 for meaningful comparisons. I selected the latter because it filters out the rising trend of people going to college.
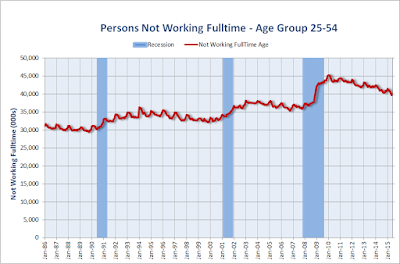
Using BLS data, I produced the following charts.
Not Working Full Time – Age Group 25-54
click on chart for sharper image
A big hat tip goes to Calculated Risk for an example of how to add recession bars. These are the first charts in which I incorporated the idea.
Note the rise over time in this series. Also not the spikes during recessions. The intra-year patterns are because I used non-seasonally adjusted data (that’s all that is available).
In regards to non-seasonally-adjusted data: Every year, there are more people working in November and December than January and February. Some hate seasonal adjustments but in general I have no problems with the concept. The charts would be smoother with seasonally-adjusted data, but it’s not available.
Regardless, the overall trends are easy to spot.
In November of 2007, at the start of the recession, there were 36.65 million people in age group 25-54 who were not working full time. There are now 40.12 Million, a rise of 3.47 million.
However, that too, is a misleading number. It does not properly factor in population shifts. The following chart addressed the above problem by looking at rise and declines on a percentage basis.
Percentage of People Aged 25-54 Not Working Full Time
click on chart for sharper image
Key Dates and Percentages
- 32.08% June 2015
- 28.57% November 2007
- 26.88% April 2000
- 28.49% June 1990
The all-time low in this series is 26.88% in April of 2000. That coincides with peak entry of women in the work force coupled with the top of the internet boom.
The pre-recession levels in 2007 and 1990 were around 28.5%. If one uses 28.5% as a measure of normalcy, then in percentage terms we are still about 3.58 percentage points too low in fulltime employment.
If one uses the record low 26.88% as a target, then we are about 5.2 percentage points lower in fulltime employment than we should be.
How Much Lower is Fulltime Employment Than It Should Be?
With the above percentages, we can do the math.
- The 25-54 population is 125,085,000.
- 3.58% of 125 million is roughly 4.48 million.
- 5.20% of 125 million is roughly 6.50 million.
In the age 25-54 demographic, this recovery lags somewhere between 4.5 and 6.5 million fulltime jobs.
Note that is just age group 25-54.
I am confident age groups 55-62 and 55-64 lag in fulltime employment as well, but I do not have the data to prove it.
We can make similar comparisons about those not working at all (i.e. “real” unemployment) and I will tackle that a bit later.
Mike “Mish” Shedlock
http://globaleconomicanalysis.blogspot.com


