ECB President Mario Draghi attempted to talk the Euro lower and the market higher today in a lengthy one hour press conference following his decision to not change change interest rates.
Markets are now closed, so let’s put a spotlight on the results (or lack thereof) of Draghi’s verbal intervention.
click on any chart for sharper image
Euro 15-Minute Chart
That is the key chart for someone who desperately desires the euro to sink vs. the US dollar.
In 15 minutes, the Euro sank from 1.09 to 1.078. For the rest of the day, the Euro rallied right back where it started from.
Five Year German Government Bond
Congratulations are in order. Draghi managed to drive the yield on the German bond from -0.20% to -0.24%.
How that’s supposed to cause inflation remains a mystery given that it’s not done a damn thing yet.
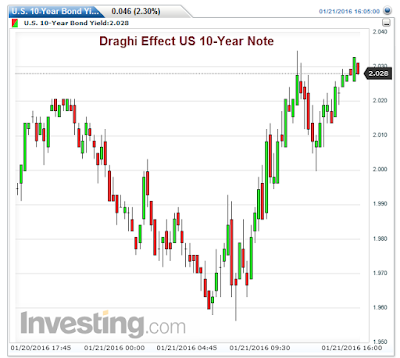
US 10-Year Government Note
Yield on the US 10-year treasury note reversed its freefall to close back above 2%. Will it stay there? Why should it?
The New York Fed is now openly discussing negative interest rates in the US if there is another crisis.
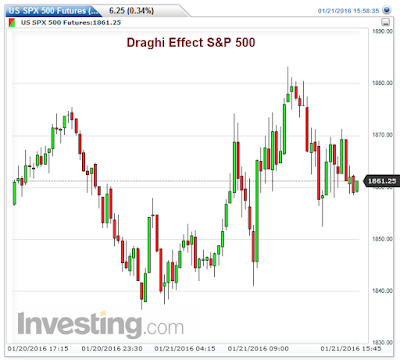
S&P 500 15-Minute Chart
The S&P 500 did a number of gyrations, but the key Draghi-sponsored effect is the largest green candle. A decent rally ensued off the lows, but that rally faded into the close.
Brent Crude 15-Minute Chart
Brent crude did rally more than $2 off the lows. However, the rally stalled before hitting $30. Neither US West Texas Intermediate (WTI), nor Brent is above $30 as I type.
Jawboning oil is not likely to work, even in the intermediate-term.
As I said earlier today Mario Draghi a Bare-Assed Emperor With No Clothes.
Mike “Mish” Shedlock


