What’s the “official” unemployment rate vs. economic reality?
In my analysis of the monthly jobs reports on the first Friday of the month, I make a statement similar to this:
“The official unemployment rate is 5.0%. However, if you start counting all the people who want a job but gave up, all the people with part-time jobs that want a full-time job, all the people who dropped off the unemployment rolls because their unemployment benefits ran out, etc., you get a closer picture of what the unemployment rate is. That number is 9.9%. Some of those dropping out of the labor force retired because they wanted to retire. The rest is disability fraud, forced retirement, discouraged workers, and kids moving back home because they cannot find a job.”
There is no way to track disability fraud for sure, But I suspect it’s 75% of those on disability.
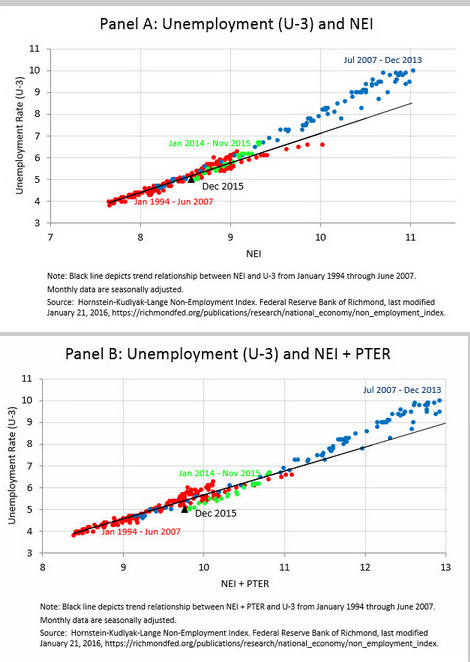
Hornstein-Kudlyak-Lange Non-Employment Index (NEI)
While not addressing disability fraud or forced retirement issues, Richmond Fed economists Andreas Hornstein and Marianna Kudlyak, and McGill University economist Fabian Lange came up with the Non-Employment Index (NEI) as a better way to track the true health of the labor market.
The NEI differs from the standard unemployment rate as a measure of resource utilization in two important ways:
1. It counts not only the unemployed, but also those out of the labor force. The latter is a diverse group that includes individuals who want a job (such as the marginally attached who are willing and able to work and sought employment in the past, but have stopped searching) and those who do not want a job (such as retirees, the disabled, students, and those who are neither retired, nor disabled, nor in school).
2. It weights the different groups of non-employed (that is, both the unemployed and people out of the labor force) according to their labor market attachment, or the likelihood that a non-employed person will transition back into the job market. Specifically, each group is weighted by its historical transition rate to employment relative to the highest transition rate among all groups (the transition rate of the short-term unemployed).
An additional version of the NEI is calculated to include people who are working part time but would like to work full time, a category called “part time for economic reasons” (NEI+PTER).
During the period prior to June 2007, there was a close linear relationship between the standard unemployment rate and the NEI.
Why Does it Matter for Policy?
The decline of the unemployment rate after the 2007-09 recession has coincided with an increase in the number of individuals out of the labor force. These observations lead to the question: Post-2007, is there substantial labor market weakness beyond what is measured by the unemployment rate? For example, discouraged individuals who are not counted in the labor force aren’t included in the standard unemployment measure, but they do factor into labor market resource utilization. Economic research has shown that discouraged workers are not as distinct from those counted as unemployed as they might appear. They return to work at rates similar to those who have been unemployed for longer than 26 weeks. Therefore, excluding discouraged workers or similar groups from the standard unemployment measure may misstate the degree to which resources in the labor market are utilized.
NEI Chart
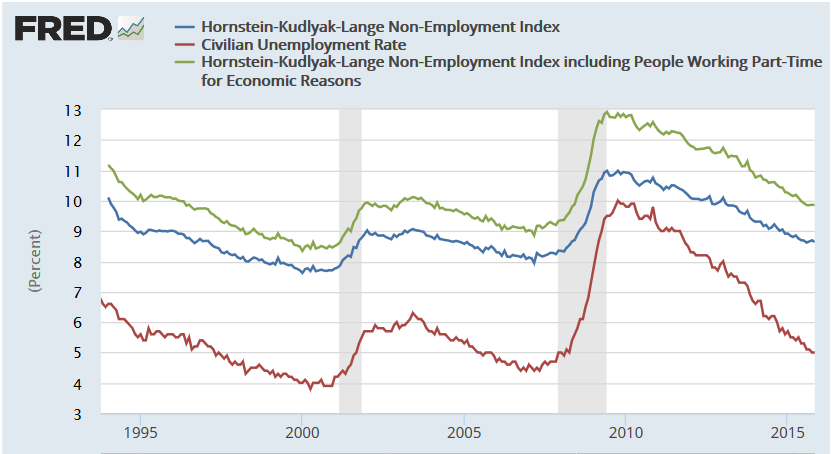
The above chart is from the Fred Blog How healthy is the labor market, really?
The article gives you the means to recreate the chart. It does not allow you to see how the authors determined the weights.
My suspicion is that their index undercounts massive disability fraud (those people who would want a job had they not been able to bilk the system). Then again, those people are not likely to be looking for a job, until the fraud stops.
Fraud and similar issues aside, this chart is a step in the right direction in terms of understanding how over-hyped the decline in the unemployment rate has been.
For those interested in how disability fraud has artificially lowered the labor force I can provide numerous examples.
Disability Fraud
I have written about Disability Fraud at least a dozen times.
60 Minutes: Mainstream Media Finally Catches on to Disability Fraud: 60 Minutes Reports on “Disability USA”
Steve Kroft on 60 Minutes reports on the alarming state of the federal disability program, which has exploded in size in the last six years and could become the first federal benefits program to run out of money.
NPR: Unwilling to Work; 25% in Hale County AL Collect Disability, 14 Million Nationwide
How Easy is it to Get Disability?
Hale county’s Dr. Timberlake asks a simple question to all his patients. “What grade did you finish?” If you claim “back pain” and do not have a degree, Timberlake believes you are disabled.
The Disability Deal
Getting disability seems easy enough in some states, and especially easy in Hale County Alabama. But is disability better than minimum wage? The answer is yes. NPR author Chana Joffe-Walt explains: ….
States Promote Fraud: States Have an Incentive to Promote (Not Stop) Disability Fraud; So How Much Fraud Is There?
This all goes back to 1996 when president Bill Clinton promised to “end welfare as we know it“. He did indeed do just that, and fraud is the result.
Why?
The federal government pays disability, but states pay part of welfare costs. This creates a huge incentive for states to actively promote disability fraud (simply to get people off state-sponsored welfare programs).
Results of Clinton Ending Welfare “As We Know It”
- Every month 14 million Americans receive a disability check.
- In 1961 the leading cause of disability was heart disease and strokes, totaling 25.7% of cases. Back pain was 8.3% of cases.
- In 2011 the leading cause of disability was a hard to disprove back pain, totaling 33.8% of cases. The second leading cause was an equally difficult to disprove “mental illness” at 19.2%. Strokes and heart disease fell to 10.6%.
- In West Virginia, a whopping 9% of the population collects disability checks. In Arkansas, 8.2% are on disability, and in Alabama and Kentucky, 8.1% collect disability. In Alaska, Hawaii, and Utah, the figure is 2.9%.
- In Hale County Alabama 1 in 4 receive disability checks.
- Nearly every case in Hale County Alabama has Dr. Perry Timberlake in common.
- Those on Supplemental Security Income, a program for children and adults who are both poor and disabled is nearly seven times larger than 30 years ago.
- Once people go onto disability, they almost never go back to work. Fewer than 1 percent of those who were on the federal program for disabled workers at the beginning of 2011 have returned to the workforce.
Dr. Timberlake asks a simple question to all his patients. “What grade did you finish?” If you claim “back pain” and do not have a degree, Timberlake believes you are disabled.
Timberlake gets paid for his “analysis“.
States are willing to go along thanks to Bill Clinton who “ended welfare as we know it“, creating an even worse disability fraud scheme in the wake.
There has been no president since, Republican or Democrat, willing to stop fraud at the federal level. And clearly Obama is doing his best to expand fraud.
Disability Deal Explained
If Democrats give enough free benefits to enough people, no one can ever vote them out of office.
Mike “Mish” Shedlock