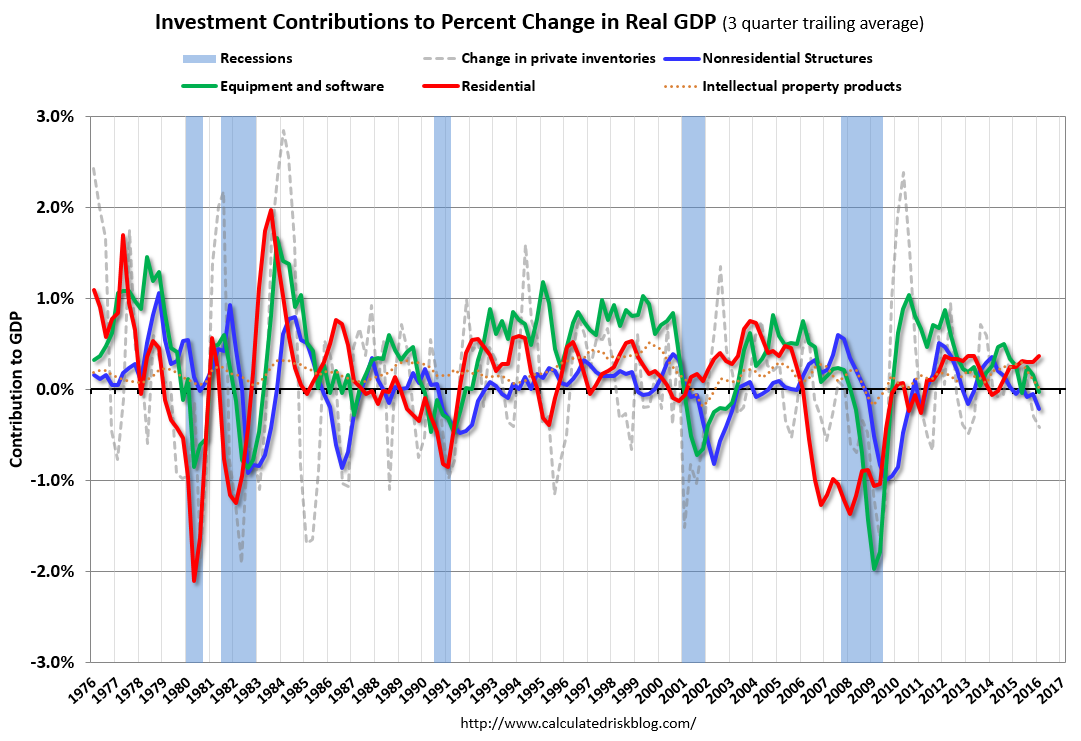
The graph below shows the contribution to GDP from residential investment, equipment and software, and nonresidential structures (3 quarter trailing average). This is important to follow because residential investment tends to lead the economy, equipment and software is generally coincident, and nonresidential structure investment trails the economy.
In the graph, red is residential, green is equipment and software, and blue is investment in non-residential structures. So the usual pattern – both into and out of recessions is – red, green, blue.
The dashed gray line is the contribution from the change in private inventories.
 Click on graph for larger image.
Residential investment (RI) increased at a 14.8% annual rate in Q1. Equipment investment decreased at a 8.6% annual rate, and investment in non-residential structures decreased at a 10.7% annual rate. On a 3 quarter trailing average basis, RI (red) is positive, equipment (green) is close to zero, and nonresidential structures (blue) is negative.
Nonresidential investment in structures typically lags the recovery, however investment in energy and power provided a boost early in this recovery – and is now causing a decline. Other areas of nonresidential are now increasing significantly. I’ll post more on the components of non-residential investment once the supplemental data is released.
I expect investment to be solid going forward (except for energy and power), and for the economy to continue to grow at a steady pace.
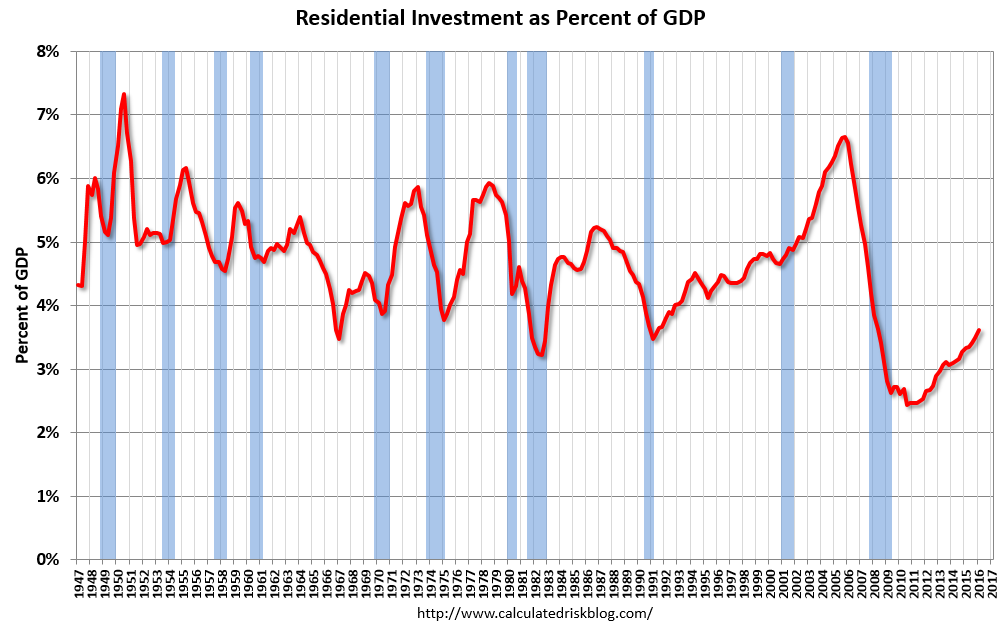
The second graph shows residential investment as a percent of GDP.
Residential Investment as a percent of GDP has been increasing, but is only just above the bottom of the previous recessions – and I expect RI to continue to increase for the next few years.
I’ll break down Residential Investment into components after the GDP details are released.
Note: Residential investment (RI) includes new single family structures, multifamily structures, home improvement, broker’s commissions, and a few minor categories.
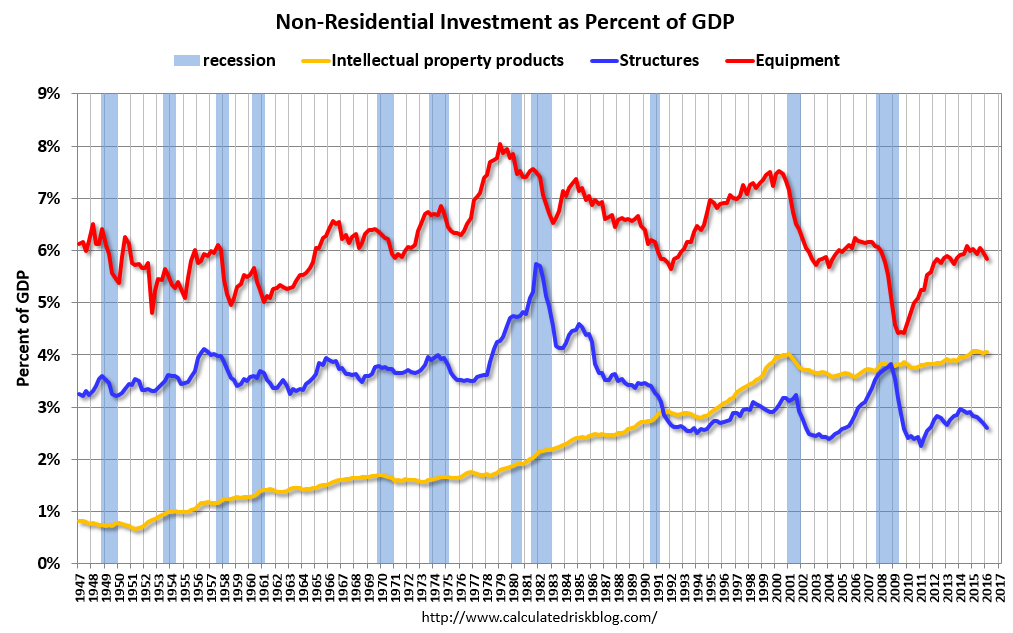 The third graph shows non-residential investment in structures, equipment and “intellectual property products”. Investment in equipment – as a percent of GDP – has been moving sideways. Other investment is generally trending up as a percent of GDP, except for nonresidential structures due to less investment in energy and power.