The Census Bureau reports New Home Sales in November were at a seasonally adjusted annual rate (SAAR) of 592 thousand.
The previous three months were revised down slightly.
“Sales of new single-family houses in November 2016 were at a seasonally adjusted annual rate of 592,000, according to estimates released jointly today by the U.S. Census Bureau and the Department of Housing and Urban Development. This is 5.2 percent above the revised October rate of 563,000 and is 16.5 percent above the November 2015 estimate of 508,000.”
emphasis added
 Click on graph for larger image.
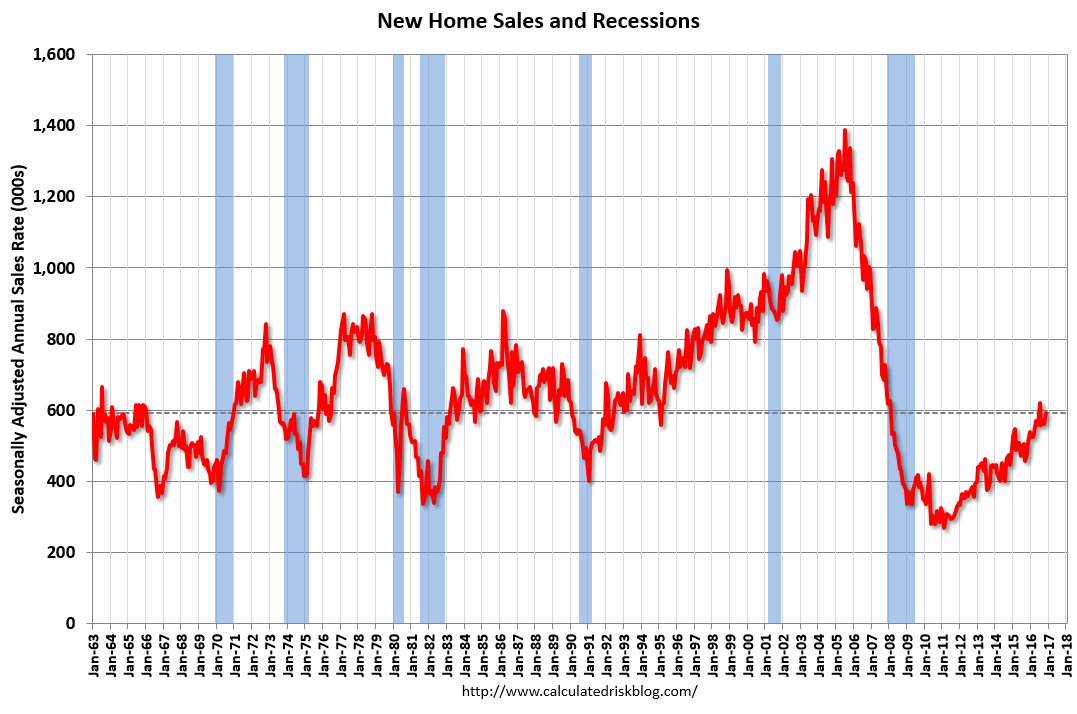
The first graph shows New Home Sales vs. recessions since 1963. The dashed line is the current sales rate.
Even with the increase in sales over the last several years, new home sales are still fairly low historically.
The second graph shows New Home Months of Supply.
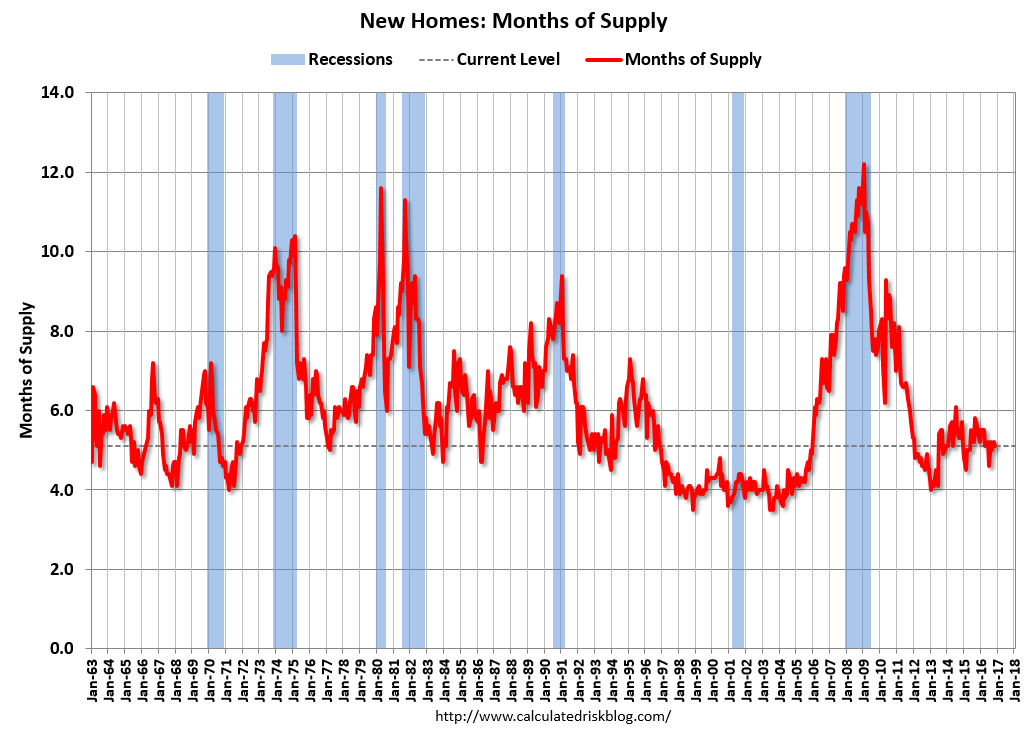 The months of supply decreased in November to 5.1 months.
The all time record was 12.1 months of supply in January 2009.
This is now in the normal range (less than 6 months supply is normal).
“The seasonally adjusted estimate of new houses for sale at the end of November was 250,000. This represents a supply of 5.1 months at the current sales rate”
 On inventory, according to the Census Bureau:
“A house is considered for sale when a permit to build has been issued in permit-issuing places or work has begun on the footings or foundation in nonpermit areas and a sales contract has not been signed nor a deposit accepted.”
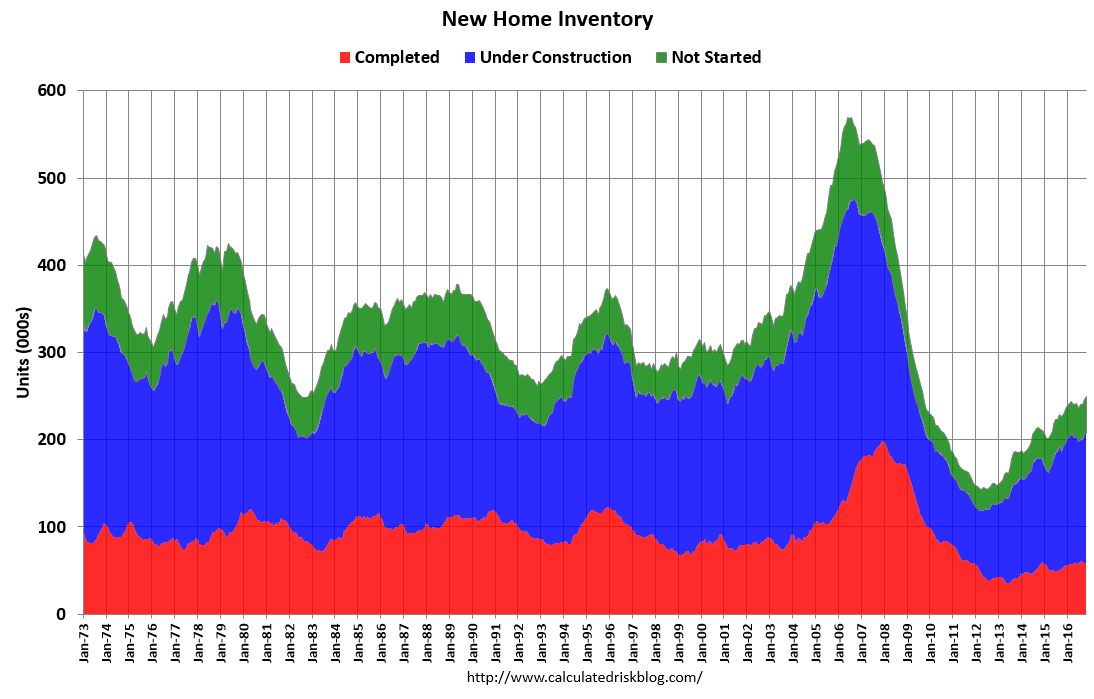
Starting in 1973 the Census Bureau broke this down into three categories: Not Started, Under Construction, and Completed.
The third graph shows the three categories of inventory starting in 1973.
The inventory of completed homes for sale is still low, and the combined total of completed and under construction is also low.
 The last graph shows sales NSA (monthly sales, not seasonally adjusted annual rate).
In November 2016 (red column), 41 thousand new homes were sold (NSA). Last year, 36 thousand homes were sold in November. This was the highest sales for November since 2007.
The all time high for November was 86 thousand in 2005, and the all time low for November was 20 thousand in 2010.
This was above expectations of 580,000 sales SAAR in November. I’ll have more later today.