New home sales for January were reported at 555,000 on a seasonally adjusted annual rate basis (SAAR). This was below the consensus forecast, and the three previous months were all revised down. So overall this was a disappointing report.
Sales were up 5.5% year-over-year in January, However, January and February were the weakest months last year on a seasonally adjusted annual rate basis – so this was an easy comparison.
Note that these sales (for January) occurred after mortgage rates increased following the election. As I’ve noted before, interest rate changes impact new home sales before existing home sales because new home sales are counted when the contract is signed, and existing home sales at the close of escrow.
This is just the second month of data after the rate increase, and we might be seeing a small dip in sales due to higher interest rates. However, so far, we haven’t seen any impact on existing home sales.
It will take several months of data to see the impact of higher mortgage rates – and this is the seasonally weak period – so we might have to wait for the March and April data.
Earlier: New Home Sales increase to 555,000 Annual Rate in January.
 Click on graph for larger image.
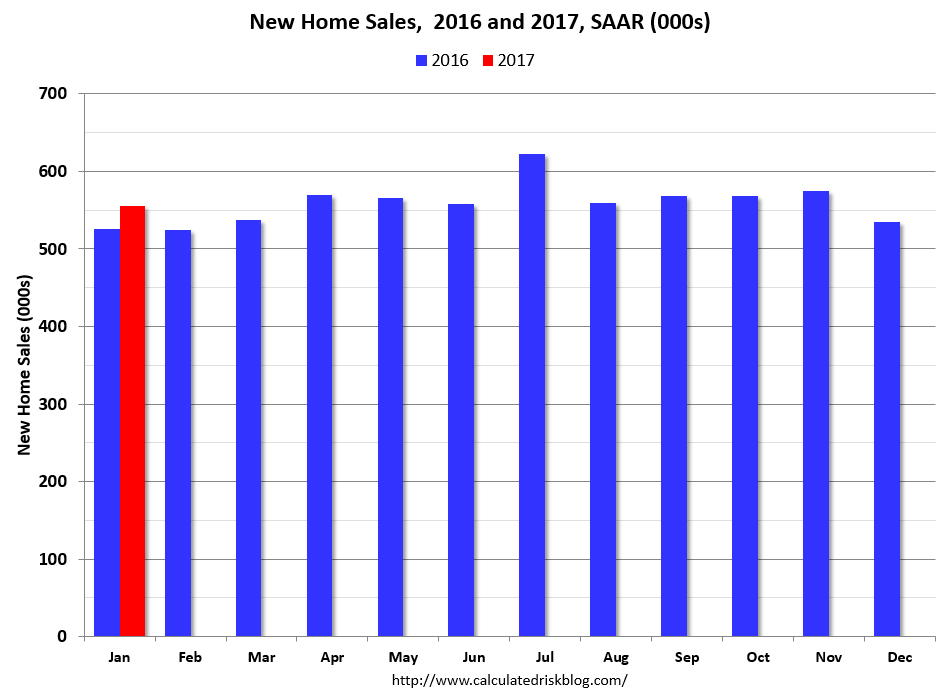
This graph shows new home sales for 2016 and 2017 by month (Seasonally Adjusted Annual Rate). Sales were up 5.5% year-over-year in January.
New home sales averaged 559 thousand per month (SAAR) in 2016, so January was about at the average rate for last year.
And here is another update to the ”distressing gap” graph that I first started posting a number of years ago to show the emerging gap caused by distressed sales. Now I’m looking for the gap to close over the next several years.
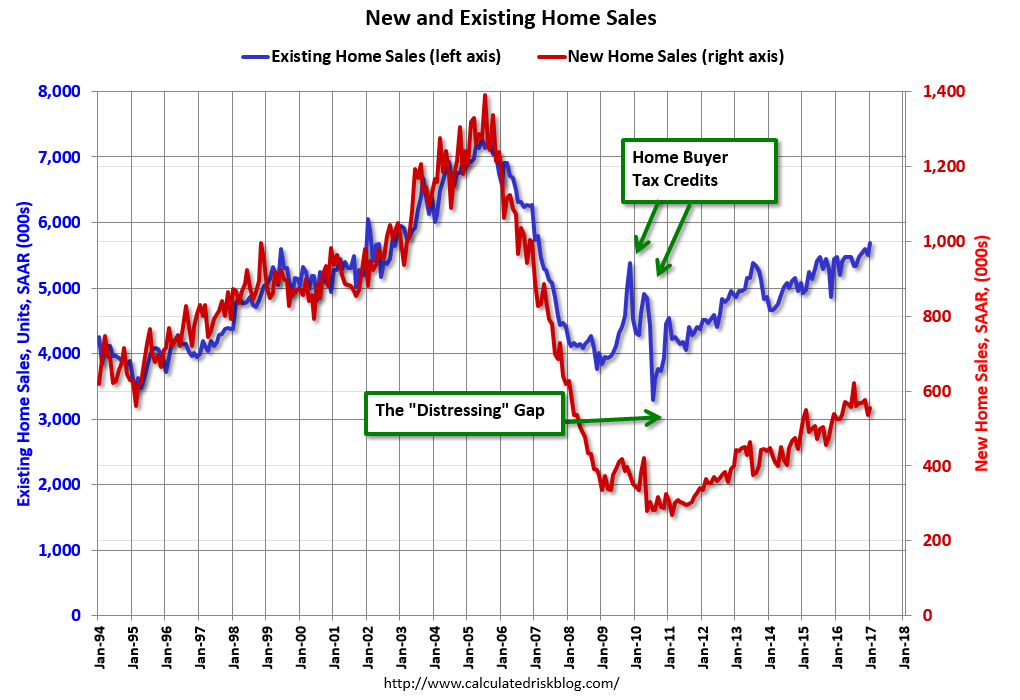 The “distressing gap” graph shows existing home sales (left axis) and new home sales (right axis) through January 2017. This graph starts in 1994, but the relationship had been fairly steady back to the ’60s.
Following the housing bubble and bust, the “distressing gap” appeared mostly because of distressed sales. The gap has persisted even though distressed sales are down significantly, since new home builders focused on more expensive homes.
I expect existing home sales to move more sideways, and I expect this gap to slowly close, mostly from an increase in new home sales.
However, this assumes that the builders will offer some smaller, less expensive homes. If not, then the gap will persist.
Note: Existing home sales are counted when transactions are closed, and new home sales are counted when contracts are signed. So the timing of sales is different.