From the NAR: Existing-Home Sales Soar 5.6 Percent in November to Strongest Pace in Over a Decade
Existing-home sales surged for the third straight month in November and reached their strongest pace in almost 11 years, according to the National Association of Realtors®. All major regions except for the West saw a significant hike in sales activity last month.
Total existing-home sales, which are completed transactions that include single-family homes, townhomes, condominiums and co-ops, jumped 5.6 percent to a seasonally adjusted annual rate of 5.81 million in November from an upwardly revised 5.50 million in October. After last month’s increase, sales are 3.8 percent higher than a year ago and are at their strongest pace since December 2006 (6.42 million).
…
Total housing inventory at the end of November dropped 7.2 percent to 1.67 million existing homes available for sale, and is now 9.7 percent lower than a year ago (1.85 million) and has fallen year-over-year for 30 consecutive months. Unsold inventory is at a 3.4-month supply at the current sales pace, which is down from 4.0 months a year ago.
emphasis added
 Click on graph for larger image.
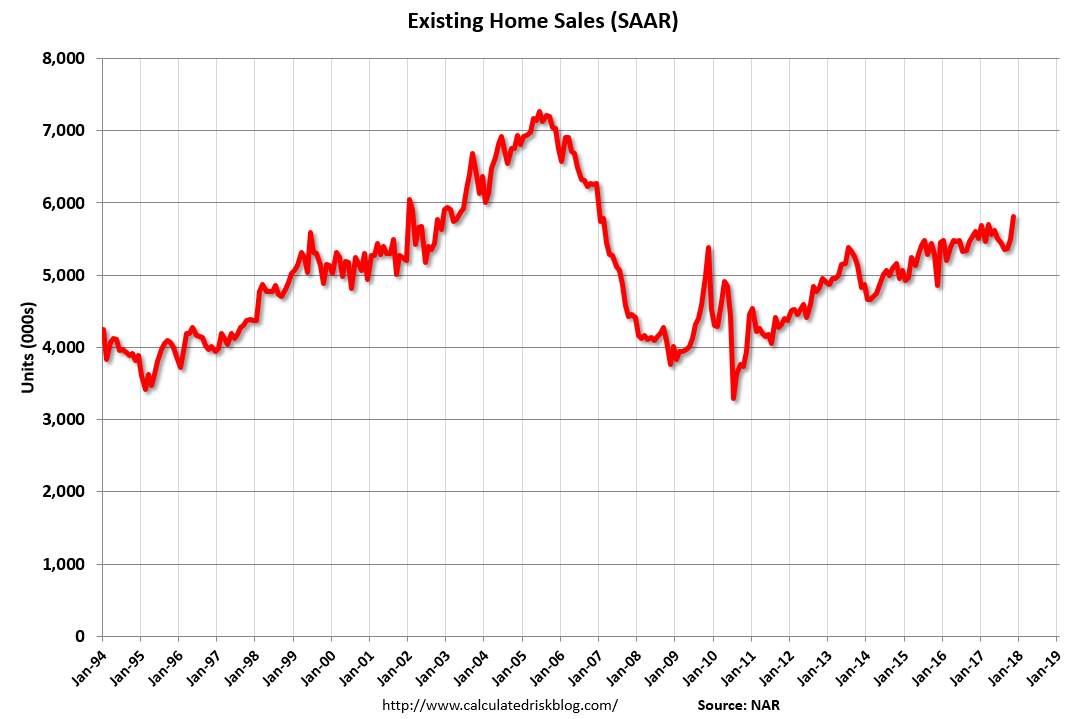
This graph shows existing home sales, on a Seasonally Adjusted Annual Rate (SAAR) basis since 1993.
Sales in November (5.81 million SAAR) were 5.6% higher than last month, and were 3.8% above the November 2016 rate.
The second graph shows nationwide inventory for existing homes.
 According to the NAR, inventory decreased to 1.67 million in November from 1.80 million in October. Headline inventory is not seasonally adjusted, and inventory usually decreases to the seasonal lows in December and January, and peaks in mid-to-late summer.
The last graph shows the year-over-year (YoY) change in reported existing home inventory and months-of-supply. Since inventory is not seasonally adjusted, it really helps to look at the YoY change. Note: Months-of-supply is based on the seasonally adjusted sales and not seasonally adjusted inventory.
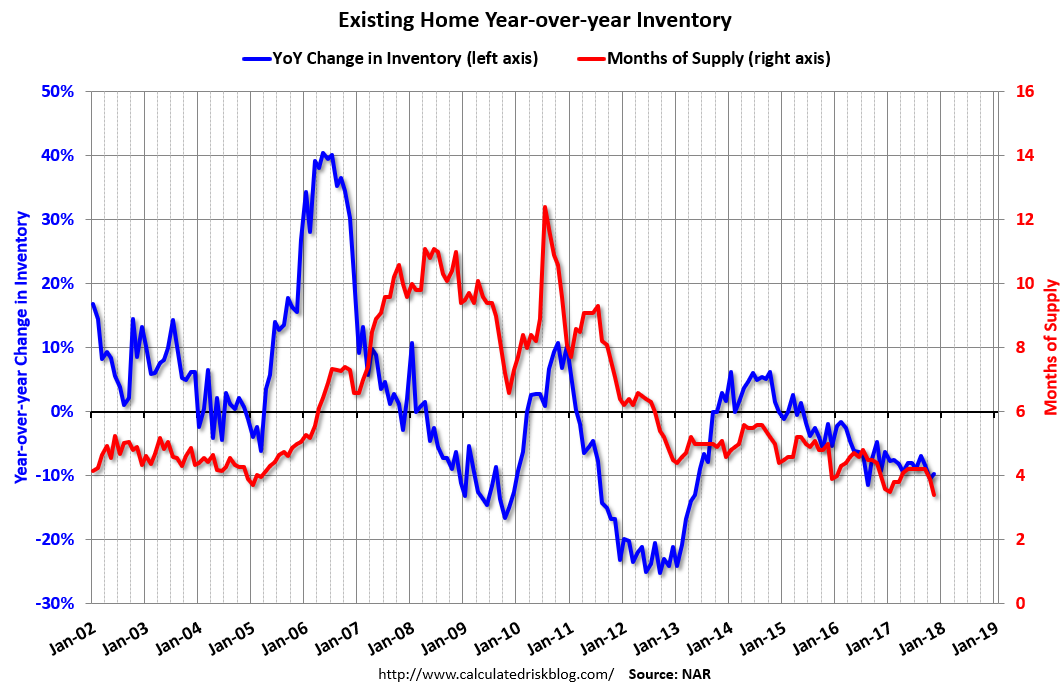 Inventory decreased 9.7% year-over-year in November compared to November 2016.
Months of supply was at 3.4 months in November.
As expected by CR readers, sales were above the consensus view. For existing home sales, a key number is inventory – and inventory is still low. I’ll have more later …