In 2017, eight FDIC insured banks failed. This was up from 5 in 2016.
The great recession / housing bust / financial crisis related failures are behind us.
The first graph shows the number of bank failures per year since the FDIC was founded in 1933.
 Click on graph for larger image.
Typically about 7 banks fail per year, so the 8 failures in 2017 was close to normal.
Note: There were a large number of failures in the ’80s and early ’90s. Many of these failures were related to loose lending, especially for commercial real estate. Also, a large number of the failures in the ’80s and ’90s were in Texas with loose regulation.
Even though there were more failures in the ’80s and early ’90s then during the recent crisis, the recent financial crisis was much worse (larger banks failed and were bailed out).
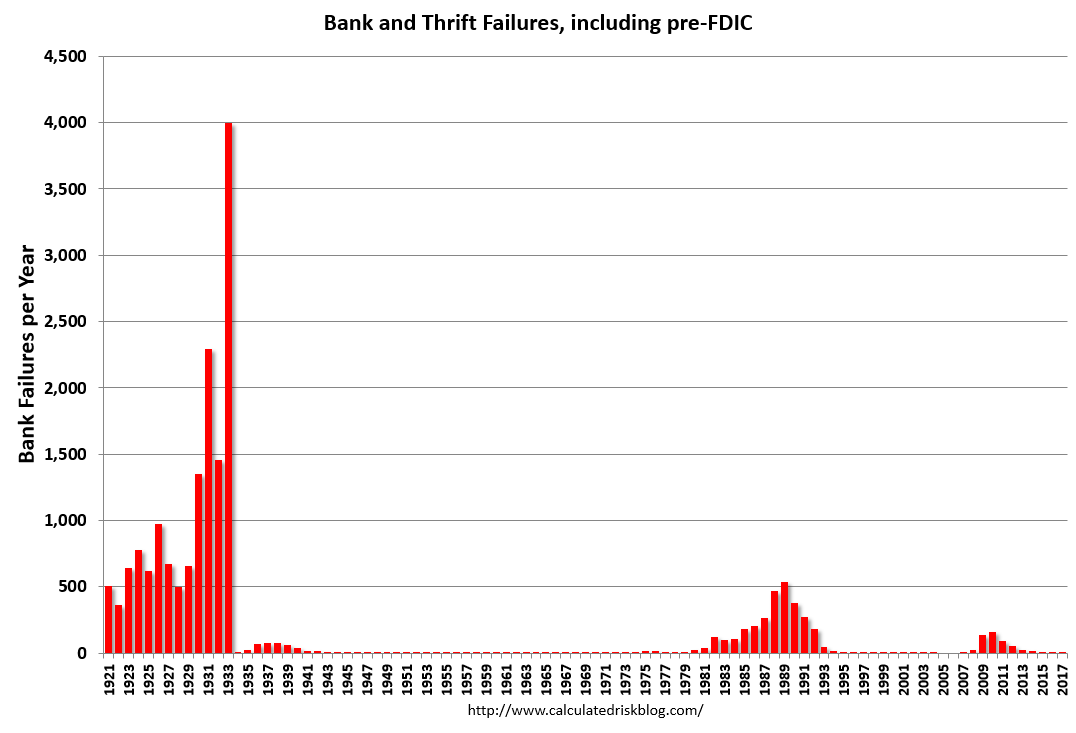 The second graph includes pre-FDIC failures. In a typical year – before the Depression – 500 banks would fail and the depositors would lose a large portion of their savings.
Then, during the Depression, thousands of banks failed. Note that the S&L crisis and recent financial crisis look small on this graph.