Notes: This CoreLogic House Price Index report is for February. The recent Case-Shiller index release was for January. The CoreLogic HPI is a three month weighted average and is not seasonally adjusted (NSA).
From CoreLogic: CoreLogic Reports Home Prices Rose 6.7 Percent Year Over Year, Increasing for the Seventh Consecutive Month in February
CoreLogic® … today released the CoreLogic Home Price Index (HPI™) and HPI Forecast™ for February 2018, which shows home prices rose both year over year and month over month. Home prices increased nationally year over year by 6.7 percent — from February 2017 to February 2018 — and on a month-over-month basis, home prices increased by 1 percent in February 2018 — compared with January 2018 — according to the CoreLogic HPI.
Looking ahead, the CoreLogic HPI Forecast indicates that the national home-price index is projected to continue to increase by 4.7 percent on a year-over-year basis from February 2018 to February 2019, with California leading the climb at a forecasted 10.3 percent year-over-year change. The CoreLogic HPI Forecast is a projection of home prices that is calculated using the CoreLogic HPI and other economic variables. Values are derived from state-level forecasts by weighting indices according to the number of owner-occupied households for each state.
“A number of western states have had hot housing markets,” said Dr. Frank Nothaft, chief economist for CoreLogic. “Idaho, Nevada, Utah and Washington all had home prices up more than 11 percent over the last year. With the recent rise in mortgage rates, affordability has fallen sharply in these states. We expect home-price growth to slow over the next 12 months, dropping to 5 to 6 percent in Idaho, Utah and Washington, and slowing to 9.6 percent in Nevada.”
emphasis added
 Click on graph for larger image.
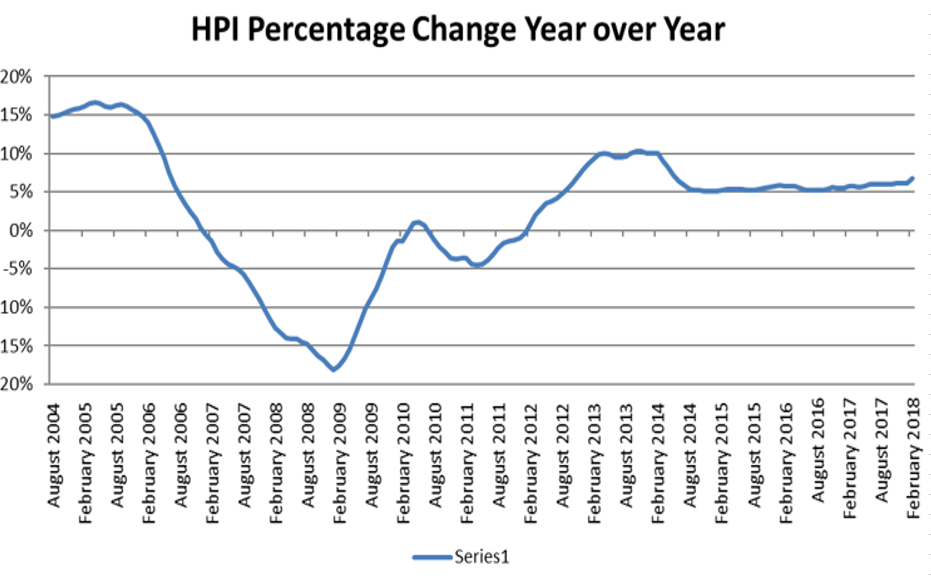
This graph from CoreLogic shows the Year-over-year change in house prices since 2004.
CR Note: The YoY increase has been in the 5% to 7% range for the last couple of years. This is towards the top end of that range.
The year-over-year comparison has been positive for six consecutive years since turning positive year-over-year in February 2012.