By request, a couple more graphs based on the February Personal Income and Outlays report.
The first graph is for the personal saving rate.
 Click on graph for larger image.
The saving rate increased to 3.4% in February.
Personal saving was $497.4 billion in February and the personal saving rate, personal saving as a percentage of disposable personal income, was 3.4 percent.
This graph shows the saving rate starting in 1959 (using a three month trailing average for smoothing) through the February Personal Income report.
After increasing sharply during the recession, and remaining around 6% for several years, the personal saving rate has decreased over the last couple of years.
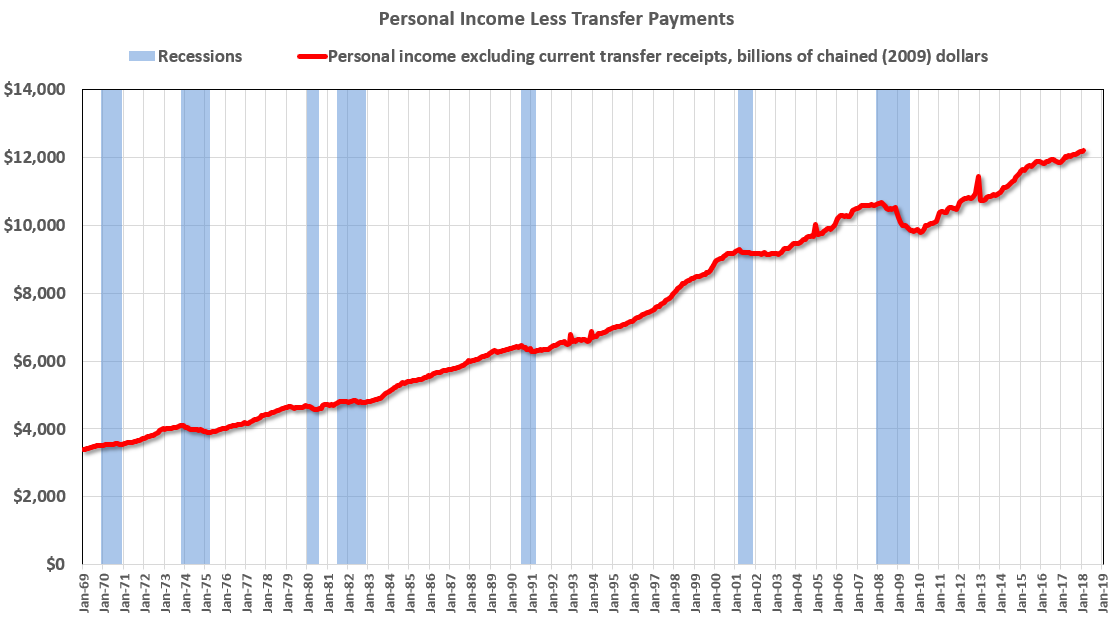 The second graph shows real personal income less transfer payments in 2009 dollars. This was slow to recover following the recession, but is now increasing steadily.
From the BEA:
Personal current transfer receipts: Consists of income payments to persons for which no current services are performed and net insurance settlements.
Examples of transfer payments are Social Security (retirement and disability), Medicare, unemployment insurance and other social programs.