IMPORTANT NOTE: In the GDP report, real residential investment was unchanged in Q1. But residential investment (RI) as a percent GDP actually increased in Q1! How can that be? The answer is that the price index for residential investment increased sharply in Q1 (up 8.5% annualized). The large increase in the residential investment price index follows what we are hearing from home builders – that material costs have increased sharply (the tariffs haven’t helped, but other prices are up too). This hurts both builders and home buyers.
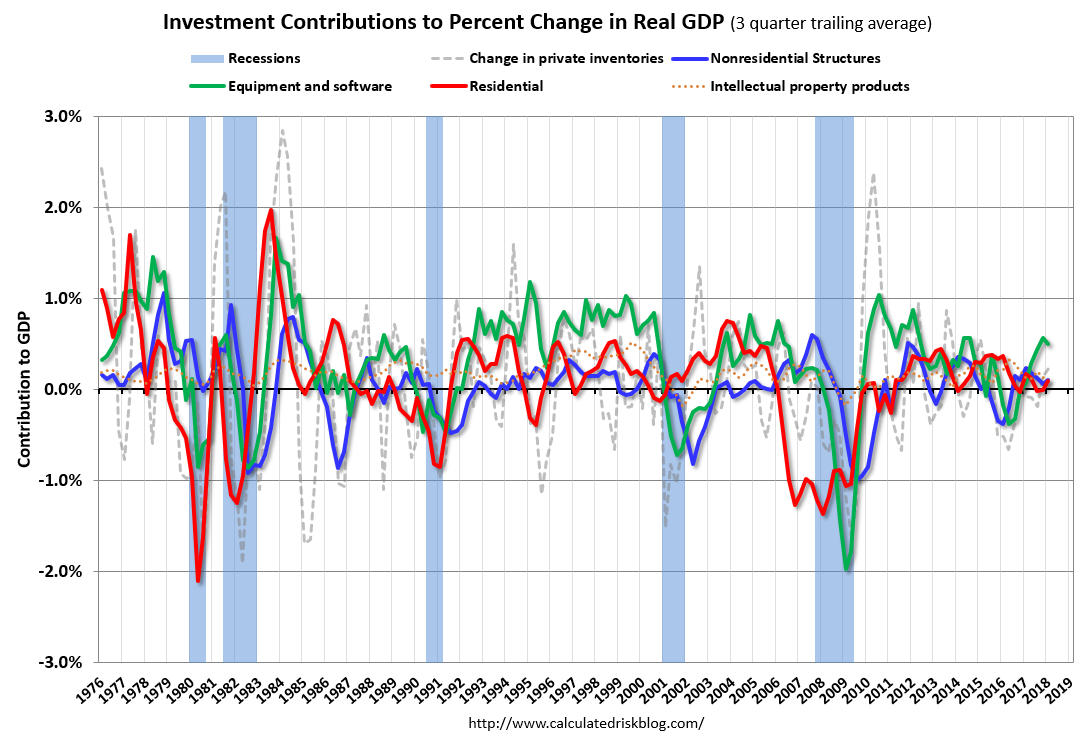
The first graph below shows the contribution to GDP from residential investment, equipment and software, and nonresidential structures (3 quarter trailing average). This is important to follow because residential investment tends to lead the economy, equipment and software is generally coincident, and nonresidential structure investment trails the economy.
In the graph, red is residential, green is equipment and software, and blue is investment in non-residential structures. So the usual pattern – both into and out of recessions is – red, green, blue.
The dashed gray line is the contribution from the change in private inventories.
 Click on graph for larger image.
Residential investment (RI) was unchanged in Q1 (0.0% annual rate in Q1). Equipment investment increased at a 4.7% annual rate, and investment in non-residential structures increased at a 12.3% annual rate.
On a 3 quarter trailing average basis, RI (red) is up, equipment (green) is solidly positive, and nonresidential structures (blue) is up slightly.
Recently real RI has been soft.
I’ll post more on the components of non-residential investment once the supplemental data is released.
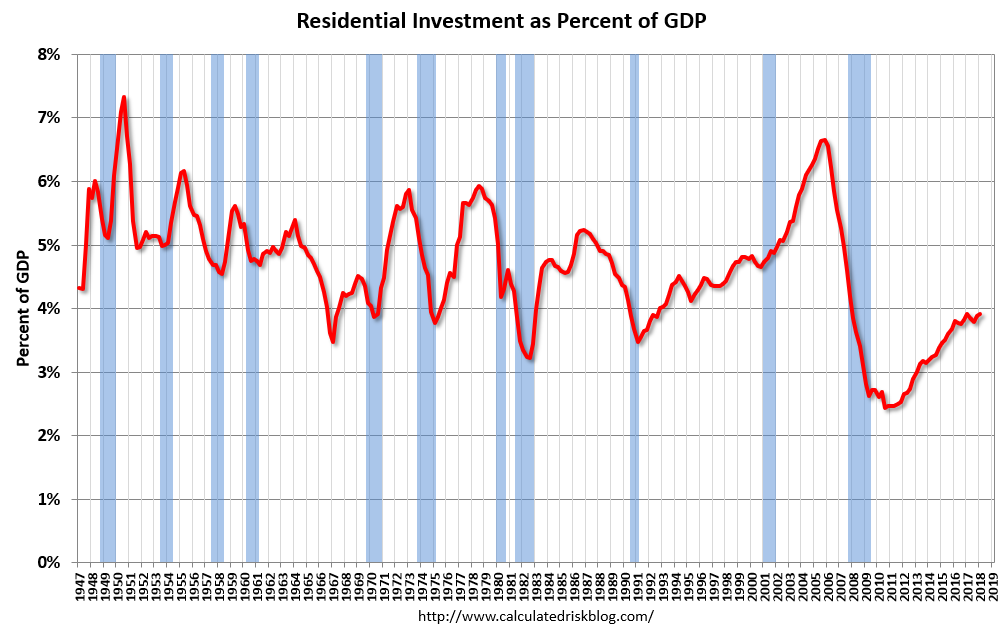 The second graph shows residential investment as a percent of GDP.
Residential Investment as a percent of GDP increased in Q1, and RI has generally been increasing. RI as a percent of GDP is only just above the bottom of the previous recessions – and I expect RI to continue to increase for the next couple of years.
The increase is now primarily coming from single family investment and home remodeling.
I’ll break down Residential Investment into components after the GDP details are released.
Note: Residential investment (RI) includes new single family structures, multifamily structures, home improvement, broker’s commissions, and a few minor categories.
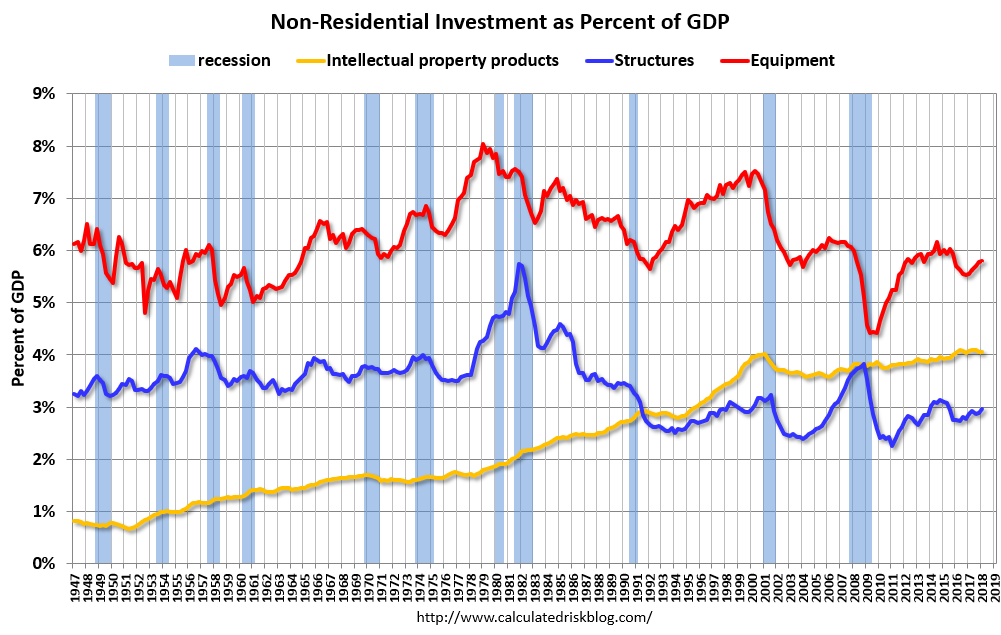 The third graph shows non-residential investment in structures, equipment and “intellectual property products”. Investment in equipment – as a percent of GDP – picked up.