The BEA has released the underlying details for the Q1 advance GDP report.
The BEA reported that investment in non-residential structures increased at a 12.3% annual pace in Q1. Investment in petroleum and natural gas exploration increased substantially recently, from a $55 billion annual rate in Q4 2016 to a $118 billion annual rate in Q1 2018 – but is still down from a recent peak of $165 billion in Q4 2014.
Without the increase in petroleum and natural gas exploration, non-residential investment would be essentially unchanged year-over-year.
 Click on graph for larger image.
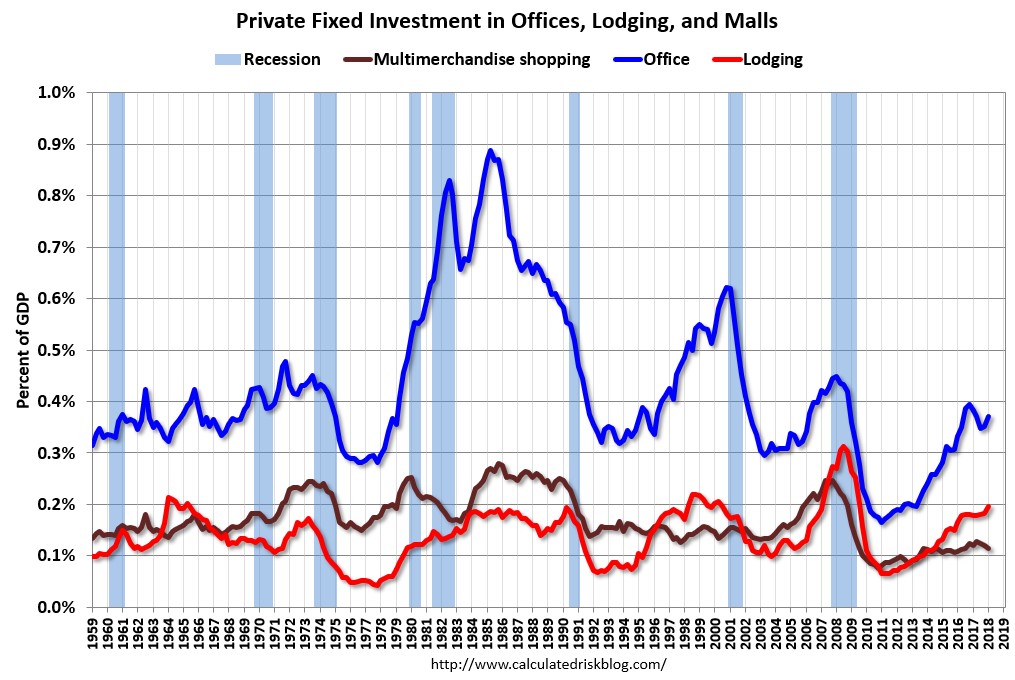
The first graph shows investment in offices, malls and lodging as a percent of GDP.
Investment in offices increased in Q1, and is up 1% year-over-year.
Investment in multimerchandise shopping structures (malls) peaked in 2007 and was down slightly year-over-year in Q1. The vacancy rate for malls is still very high, so investment will probably stay low for some time.
Lodging investment increased in Q1, and lodging investment is up 14% year-over-year.
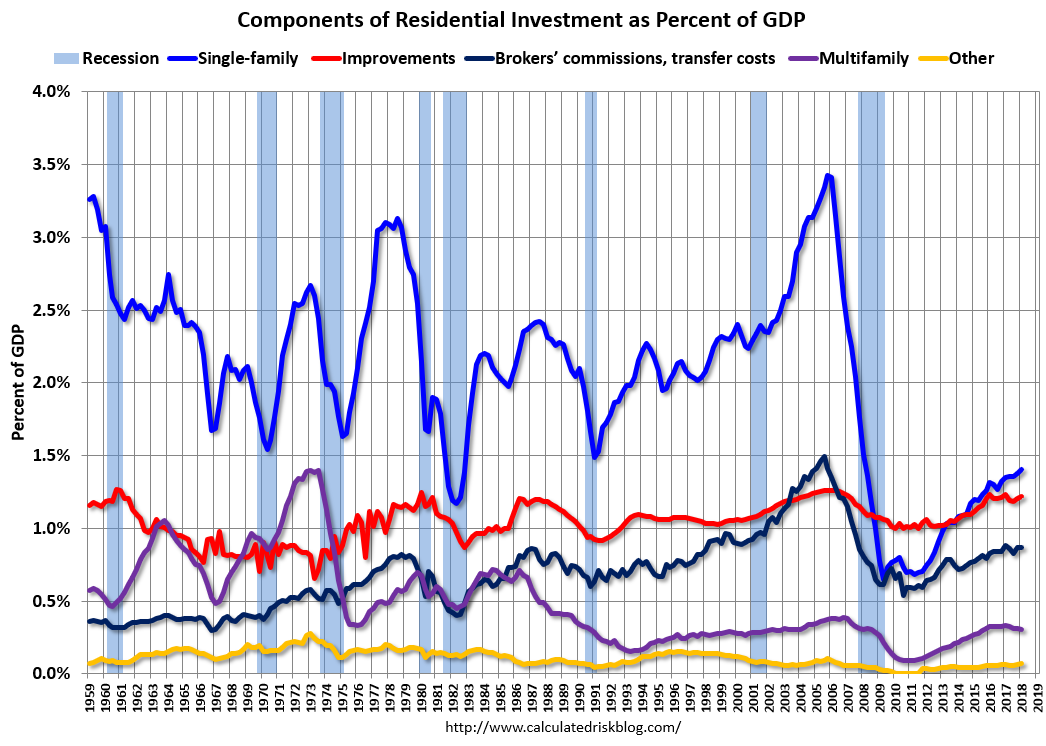 The second graph is for Residential investment components as a percent of GDP. According to the Bureau of Economic Analysis, RI includes new single family structures, multifamily structures, home improvement, Brokers’ commissions and other ownership transfer costs, and a few minor categories (dormitories, manufactured homes).
Home improvement was the top category for five consecutive years following the housing bust … but now investment in single family structures has been back on top for the last four years and will probably stay there for a long time.
However – even though investment in single family structures has increased from the bottom – single family investment is still very low, and still below the bottom for previous recessions as a percent of GDP. I expect further increases over the next few years.
Investment in single family structures was $280 billion (SAAR) (about 1.4% of GDP), and was up in Q1 compared to Q4.
Investment in multi-family structures declined in Q1.
Investment in home improvement was at a $243 billion Seasonally Adjusted Annual Rate (SAAR) in Q1 (about 1.2% of GDP). Home improvement spending has been solid.