From the NAR: Existing-Home Sales Slide 2.5 Percent in April
After moving upward for two straight months, existing-home sales retreated in April on both a monthly and annualized basis, according to the National Association of Realtors®. All four major regions saw no gain in sales activity last month.
Total existing-home sales, which are completed transactions that include single-family homes, townhomes, condominiums and co-ops, decreased 2.5 percent to a seasonally adjusted annual rate of 5.46 million in April from 5.60 million in March. With last month’s decline, sales are now 1.4 percent below a year ago and have fallen year-over-year for two straight months.
…
Total housing inventory at the end of April increased 9.8 percent to 1.80 million existing homes available for sale, but is still 6.3 percent lower than a year ago (1.92 million) and has fallen year-over-year for 35 consecutive months. Unsold inventory is at a 4.0-month supply at the current sales pace (4.2 months a year ago).
emphasis added
 Click on graph for larger image.
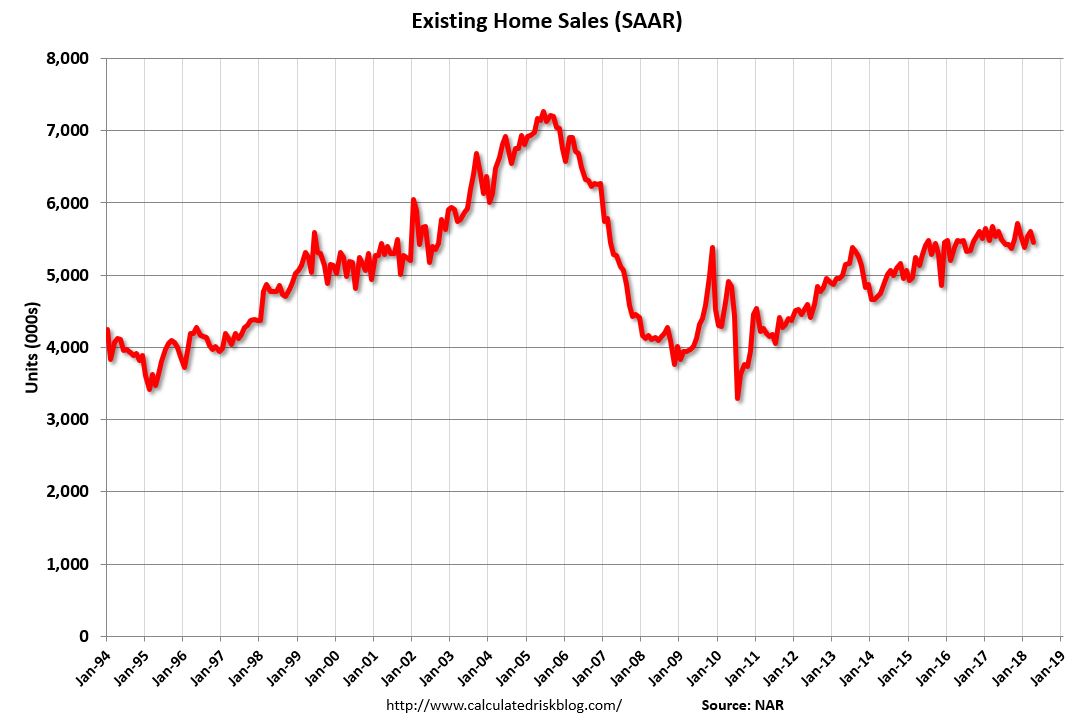
This graph shows existing home sales, on a Seasonally Adjusted Annual Rate (SAAR) basis since 1993.
Sales in April (5.46 million SAAR) were 2.5% lower than last month, and were 1.4% below the April 2017 rate.
The second graph shows nationwide inventory for existing homes.
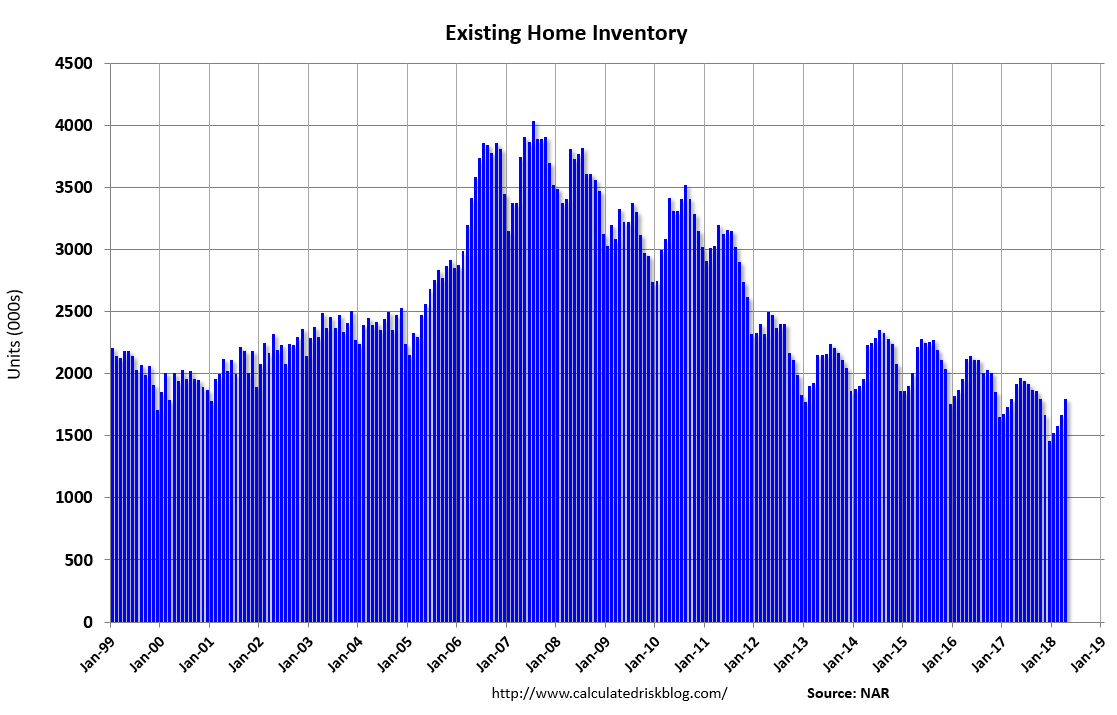 According to the NAR, inventory increased to 1.80 million in April from 1.67 million in March. Headline inventory is not seasonally adjusted, and inventory usually decreases to the seasonal lows in December and January, and peaks in mid-to-late summer.
The last graph shows the year-over-year (YoY) change in reported existing home inventory and months-of-supply. Since inventory is not seasonally adjusted, it really helps to look at the YoY change. Note: Months-of-supply is based on the seasonally adjusted sales and not seasonally adjusted inventory.
 Inventory decreased 6.3% year-over-year in April compared to April 2017.
Months of supply was at 4.0 months in April.
Sales were below the consensus view. For existing home sales, a key number is inventory – and inventory is still low. I’ll have more later …