Earlier: NAR: “Existing-Home Sales Slide 2.5 Percent in April”
A few key points:
1) As usual, housing economist Tom Lawler’s forecast was closer to the NAR report than the consensus. See: Lawler: Early Read on Existing Home Sales in April.
2) Inventory is still very low and falling year-over-year (YoY) with inventory down 6.3% year-over-year in March). This was the 35th consecutive month with a year-over-year decline in inventory, however the YoY declines have been getting smaller. And some areas of the country are now reporting YoY increases in inventory.
More inventory would probably mean smaller price increases, and less inventory somewhat larger price increases.
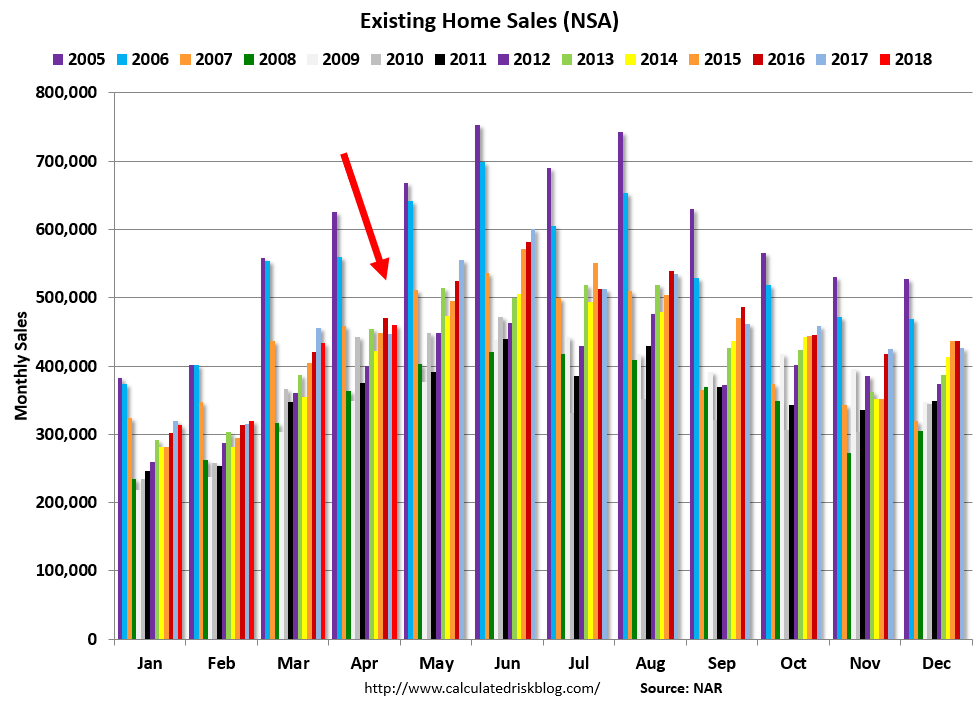
The following graph shows existing home sales Not Seasonally Adjusted (NSA).
 Click on graph for larger image.
Sales NSA in April (460,000, red column) were above sales in April 2017 (447,000, NSA).
Sales NSA through April are down about 1% from the same period in 2017.
This is a small decline – and it is too early to tell if there is an impact from higher interest rates and / or the changes to the tax law on home sales.
And here is another update to the ”distressing gap” graph that I first started posting a number of years ago to show the emerging gap caused by distressed sales. Now I’m looking for the gap to close over the next several years.
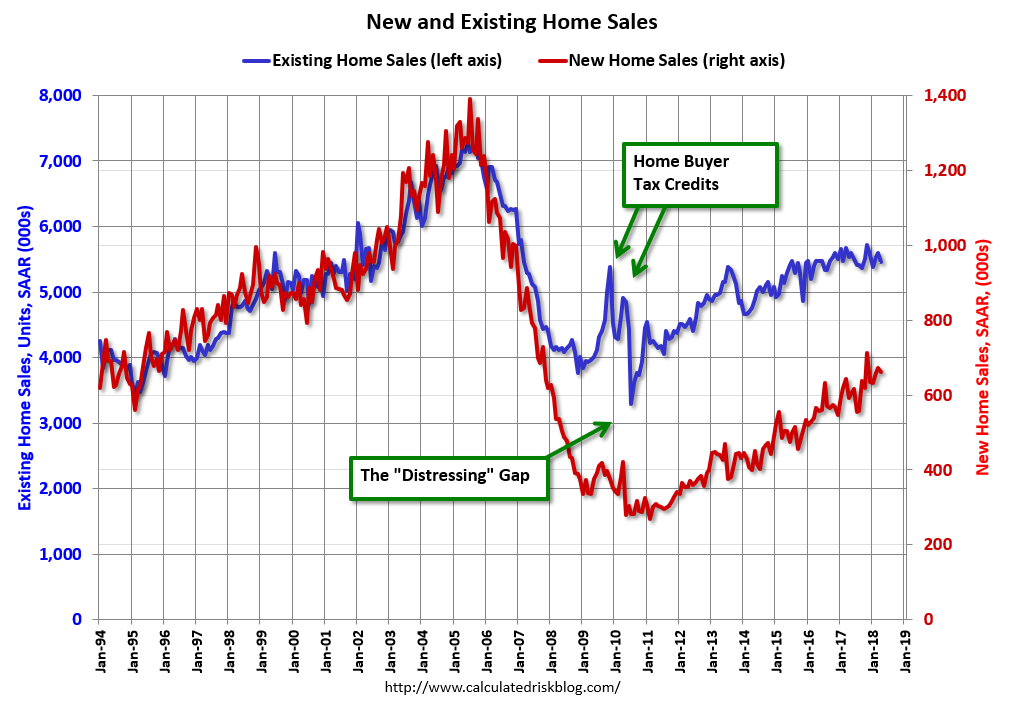 The “distressing gap” graph shows existing home sales (left axis) and new home sales (right axis) through April 2018. This graph starts in 1994, but the relationship had been fairly steady back to the ’60s.
Following the housing bubble and bust, the “distressing gap” appeared mostly because of distressed sales. The gap has persisted even though distressed sales are down significantly, since new home builders focused on more expensive homes.
I expect existing home sales to move more sideways, and I expect this gap to slowly close, mostly from an increase in new home sales.
However, this assumes that the builders will offer some smaller, less expensive homes. If not, then the gap will persist.
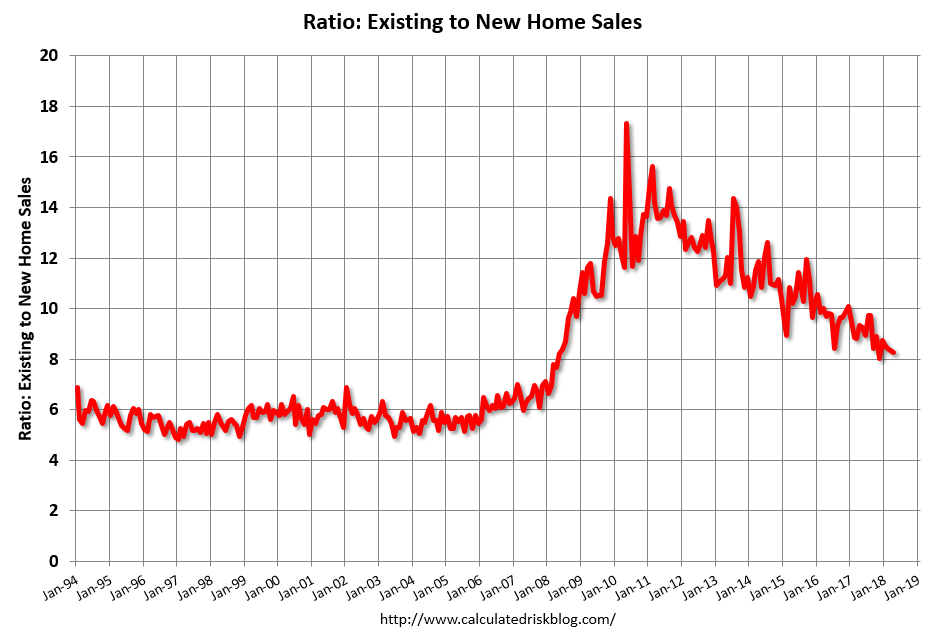 Another way to look at this is a ratio of existing to new home sales.
This ratio was fairly stable from 1994 through 2006, and then the flood of distressed sales kept the number of existing home sales elevated and depressed new home sales. (Note: This ratio was fairly stable back to the early ’70s, but I only have annual data for the earlier years).
In general the ratio has been trending down since the housing bust, and this ratio will probably continue to trend down over the next several years.
Note: Existing home sales are counted when transactions are closed, and new home sales are counted when contracts are signed. So the timing of sales is different.