The Federal Reserve released the Q1 2019 Flow of Funds report today: Flow of Funds.
According to the Fed, household net worth increased in Q1 2019 to $108.6 trillion, from $104.0 trillion in Q4 2018.
The Fed estimated that the value of household real estate increased to $26.1 trillion in Q1. The value of household real estate is now above the bubble peak in early 2006 – but not adjusted for inflation, and this also includes new construction.
 Click on graph for larger image.
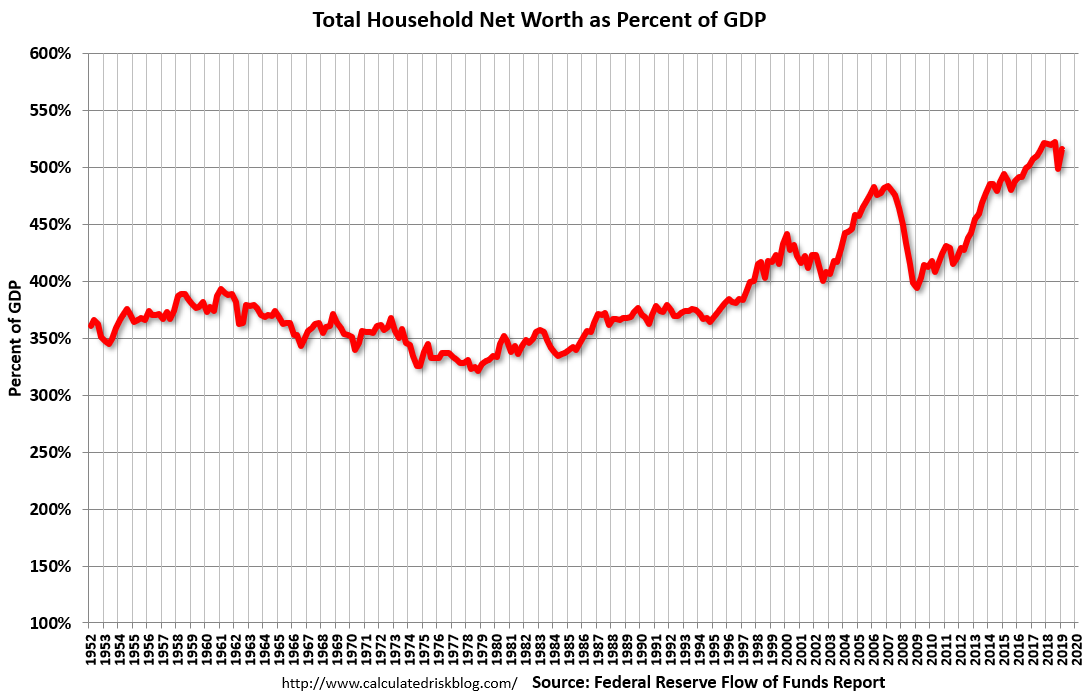
The first graph shows Households and Nonprofit net worth as a percent of GDP. Household net worth, as a percent of GDP, is higher than the peak in 2006 (housing bubble), and above the stock bubble peak.
This includes real estate and financial assets (stocks, bonds, pension reserves, deposits, etc) net of liabilities (mostly mortgages). Note that this does NOT include public debt obligations.
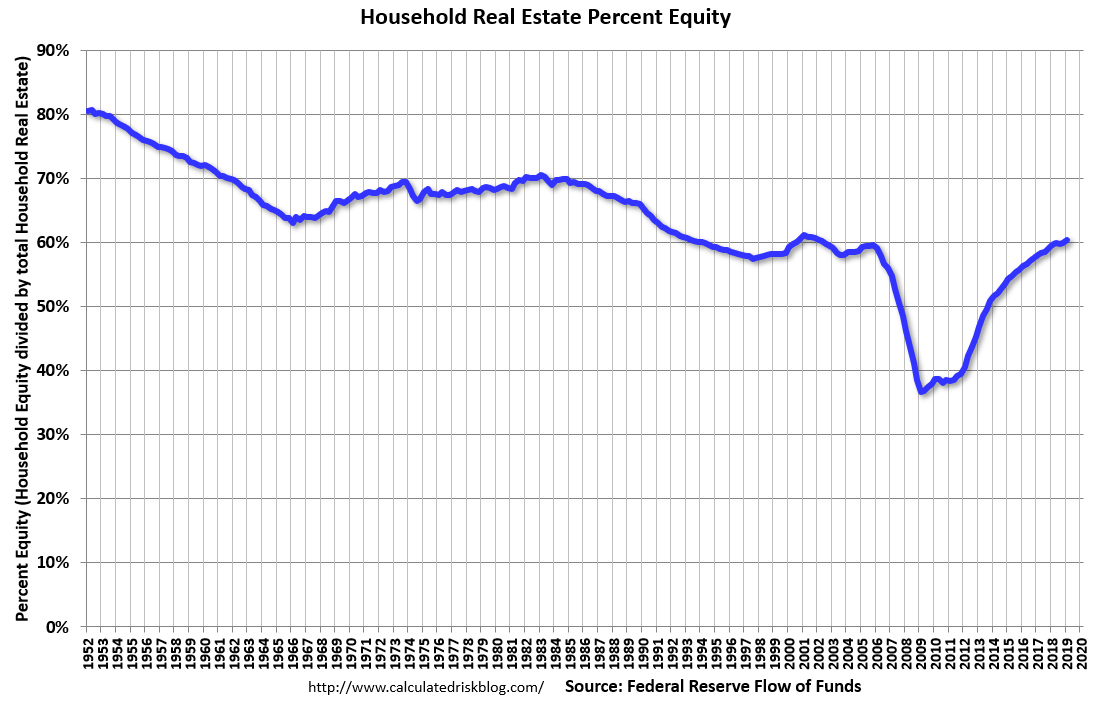 This graph shows homeowner percent equity since 1952.
Household percent equity (as measured by the Fed) collapsed when house prices fell sharply in 2007 and 2008.
In Q1 2019, household percent equity (of household real estate) was at 60.4% – up from Q4, and the highest since 2002. This was because of an increase in house prices in Q1 (the Fed uses CoreLogic).
Note: about 30.3% of owner occupied households had no mortgage debt as of April 2010. So the approximately 50+ million households with mortgages have far less than 60.4% equity – and about 2 million homeowners still have negative equity.
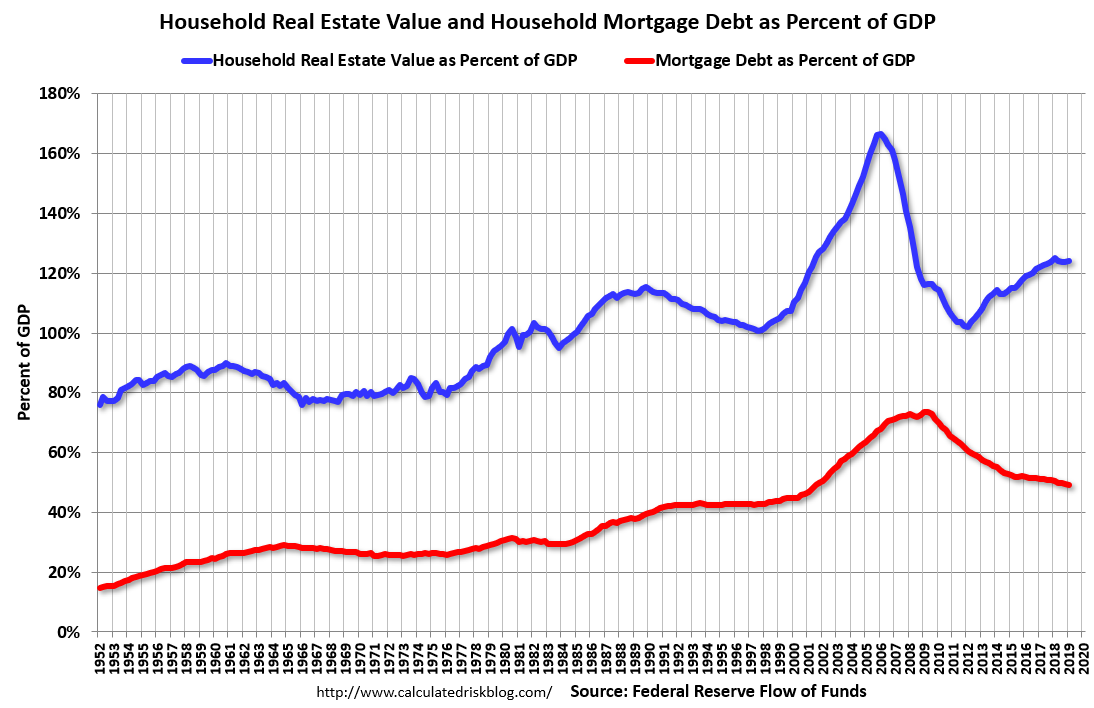 The third graph shows household real estate assets and mortgage debt as a percent of GDP.
Mortgage debt increased by $25 billion in Q1.
Mortgage debt has declined by $0.34 trillion from the peak, and, as a percent of GDP is at 49.2%, down from a peak of 73.5% of GDP during the housing bubble.
The value of real estate, as a percent of GDP, increased slightly in Q1, and is above the average of the last 30 years (excluding bubble). However, mortgage debt as a percent of GDP, continues to decline.