The BLS reported this morning:
The Consumer Price Index for Urban Wage Earners and Clerical Workers (CPI-W) increased 1.4 percent over the last 12 months to an index level of 249.747 (1982-84=100). For the month, the index was unchanged prior to seasonal adjustment.
CPI-W is the index that is used to calculate the Cost-Of-Living Adjustments (COLA). The calculation dates have changed over time (see Cost-of-Living Adjustments), but the current calculation uses the average CPI-W for the three months in Q3 (July, August, September) and compares to the average for the highest previous average of Q3 months. Note: this is not the headline CPI-U, and is not seasonally adjusted (NSA).
• In 2018, the Q3 average of CPI-W was 246.352.
The 2018 Q3 average was the highest Q3 average, so we only have to compare Q3 this year to last year.
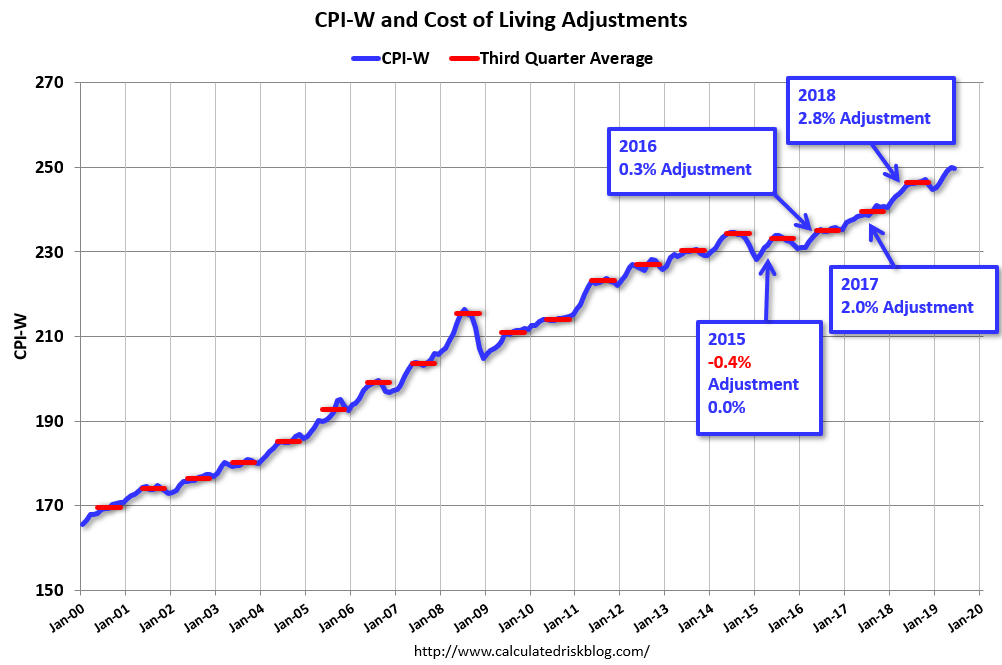 Click on graph for larger image.
This graph shows CPI-W since January 2000. The red lines are the Q3 average of CPI-W for each year.
Note: The year labeled for the calculation, and the adjustment is effective for December of that year (received by beneficiaries in January of the following year).
CPI-W was up 1.4% year-over-year in June, and although this is very early – we need the data for July, August and September – my current guess is COLA will probably be between 1% and 2% this year, the smallest increase since 2016.
Contribution and Benefit Base
The contribution base will be adjusted using the National Average Wage Index. This is based on a one year lag. The National Average Wage Index is not available for 2018 yet, but wages probably increased again in 2018. If wages increased the same as in 2017, then the contribution base next year will increase to around $137,600 in 2020, from the current $132,900.
Remember – this is an early look. What matters is average CPI-W for all three months in Q3 (July, August and September).