From the NAR: Home Sales Increase Year-Over-Year Despite Expected Monthly March Sales Decline Due to Impact of COVID-19
Existing-home sales fell in March following a February that saw significant nationwide gains, according to the National Association of Realtors®. Each of the four major regions reported a dip in sales, with the West suffering the largest decrease.
Total existing-home sales, completed transactions that include single-family homes, townhomes, condominiums and co-ops, dropped 8.5% from February to a seasonally-adjusted annual rate of 5.27 million in March. Despite the decline, overall sales increased year-over-year for the ninth straight month, up 0.8% from a year ago (5.23 million in March 2019).
…
Total housing inventory at the end of March totaled 1.50 million units, up 2.7% from February, but down 10.2% from one year ago (1.67 million). Unsold inventory sits at a 3.4-month supply at the current sales pace, up from three months in February and down from the 3.8-month figure recorded in March 2019.
emphasis added
 Click on graph for larger image.
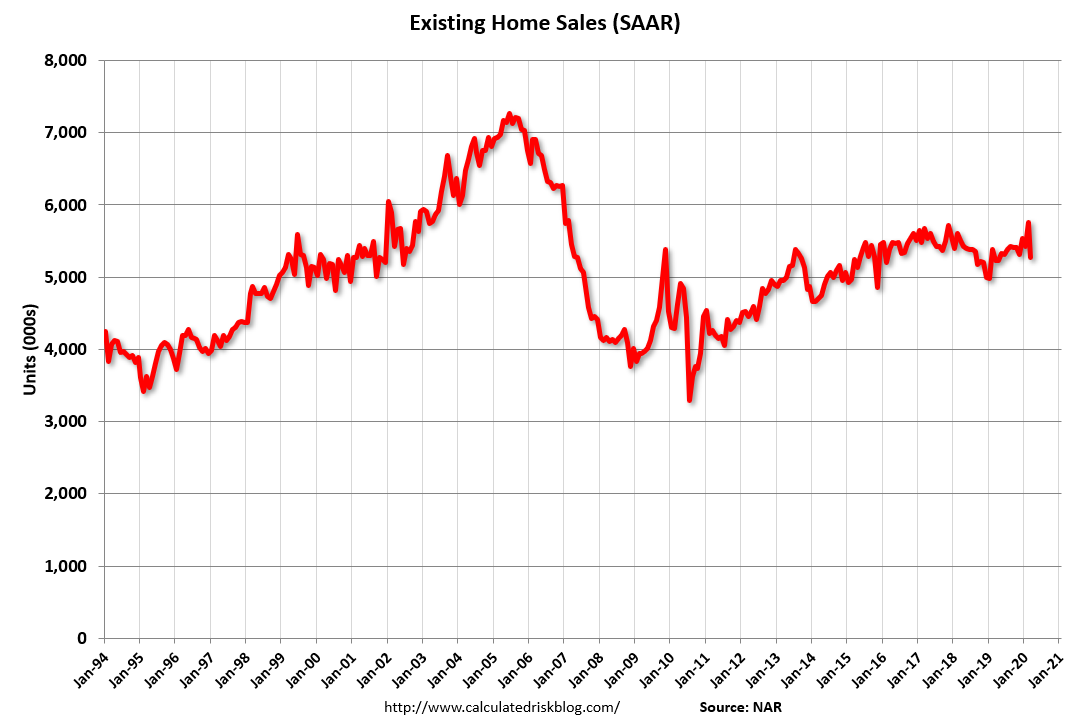
This graph shows existing home sales, on a Seasonally Adjusted Annual Rate (SAAR) basis since 1993.
Sales in March (5.27 million SAAR) were down 8.5% from last month, and were 0.8% above the March 2019 sales rate.
The second graph shows nationwide inventory for existing homes.
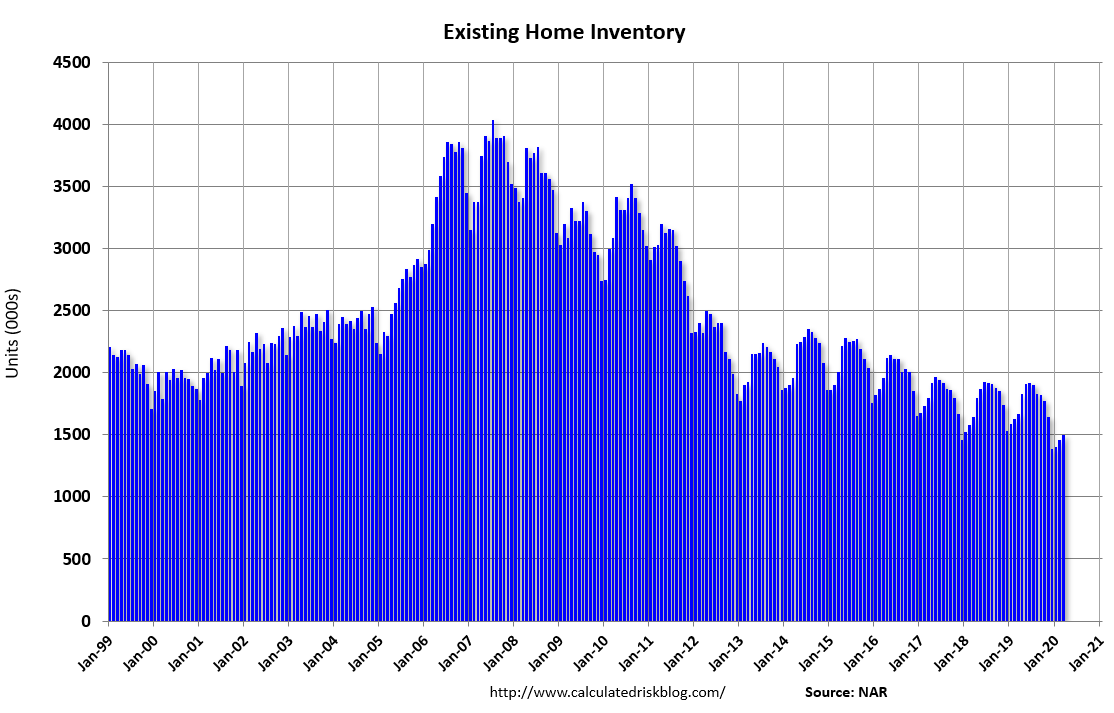 According to the NAR, inventory increased to 1.50 million in March from 1.46 million in February. Headline inventory is not seasonally adjusted, and inventory usually decreases to the seasonal lows in December and January, and peaks in mid-to-late summer.
The last graph shows the year-over-year (YoY) change in reported existing home inventory and months-of-supply. Since inventory is not seasonally adjusted, it really helps to look at the YoY change. Note: Months-of-supply is based on the seasonally adjusted sales and not seasonally adjusted inventory.
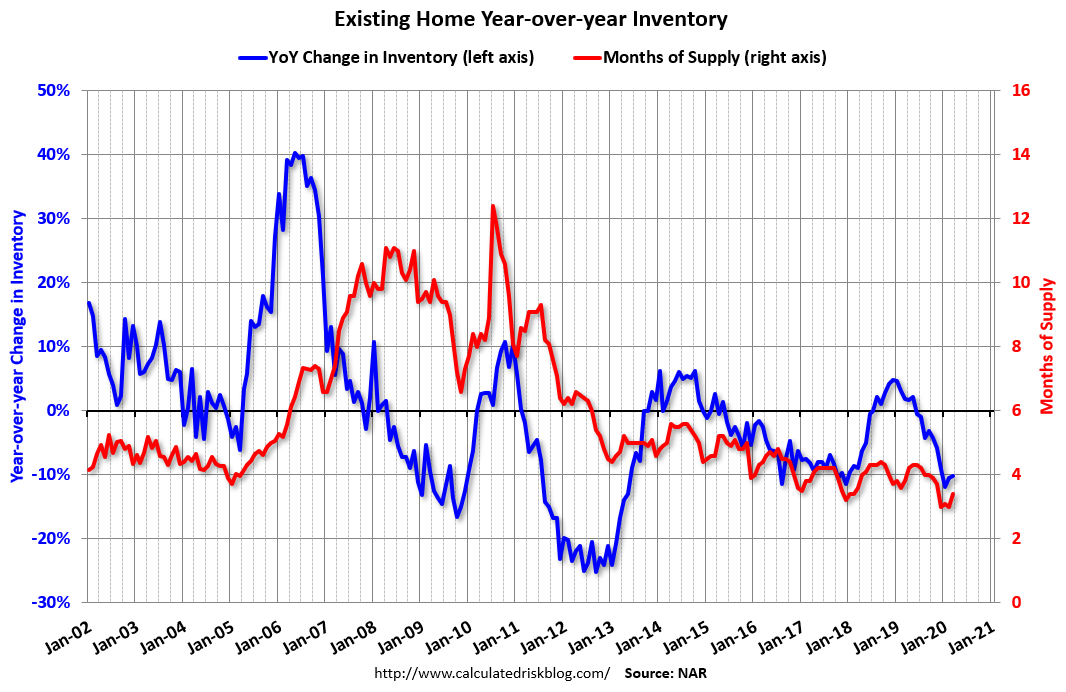 Inventory was down 10.2% year-over-year in March compared to March 2019.
Months of supply was increased to 3.4 months in March.
This was close to the consensus forecast. I’ll have more later …