Investment has been weak for some time, and slumped in Q1, and fell off a cliff in Q2 along with the overall economy.
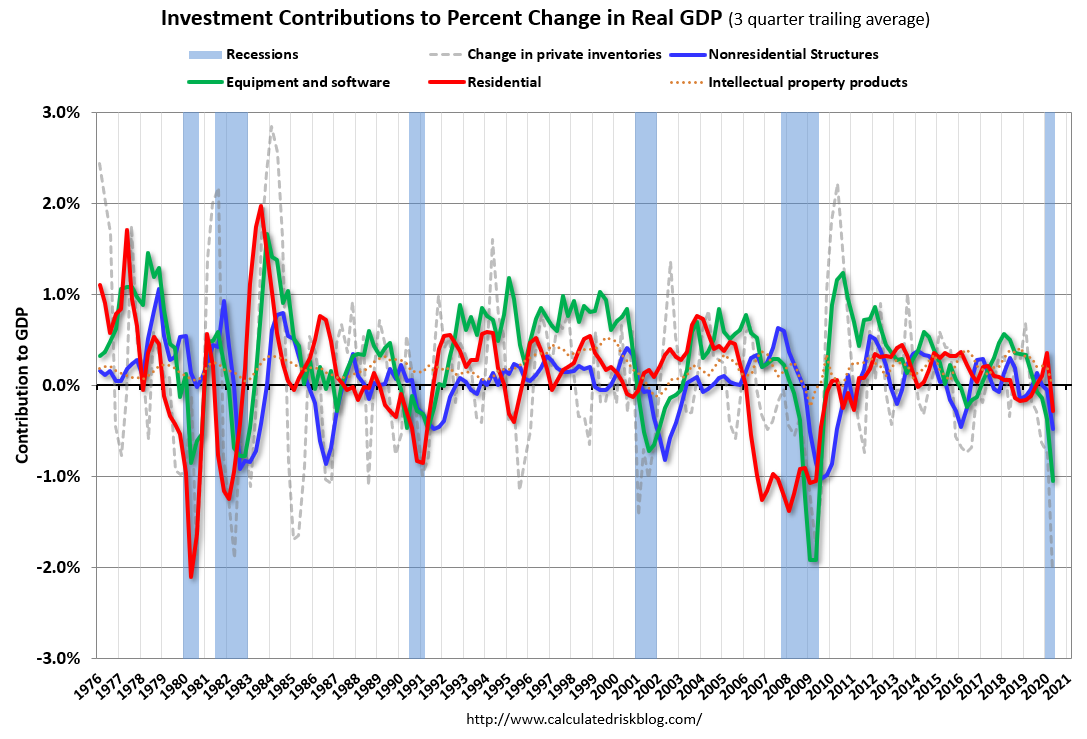
The first graph below shows the contribution to GDP from residential investment, equipment and software, and nonresidential structures (3 quarter trailing average). This is important to follow because residential investment tends to lead the economy, equipment and software is generally coincident, and nonresidential structure investment trails the economy.
In the graph, red is residential, green is equipment and software, and blue is investment in non-residential structures. So the usual pattern – both into and out of recessions is – red, green, blue.
Of course – with the sudden economic stop due to COVID-19 – the usual pattern doesn’t apply.
The dashed gray line is the contribution from the change in private inventories.
 Click on graph for larger image.
Residential investment (RI) decreased at a 38.7% annual rate in Q2. Equipment investment decreased at a 37.7% annual rate, and investment in non-residential structures decreased at a 34.9% annual rate.
On a 3 quarter trailing average basis, RI (red) is down solidly, equipment (green) is strongly negative, and nonresidential structures (blue) is also down.
I’ll post more on the components of non-residential investment once the supplemental data is released.
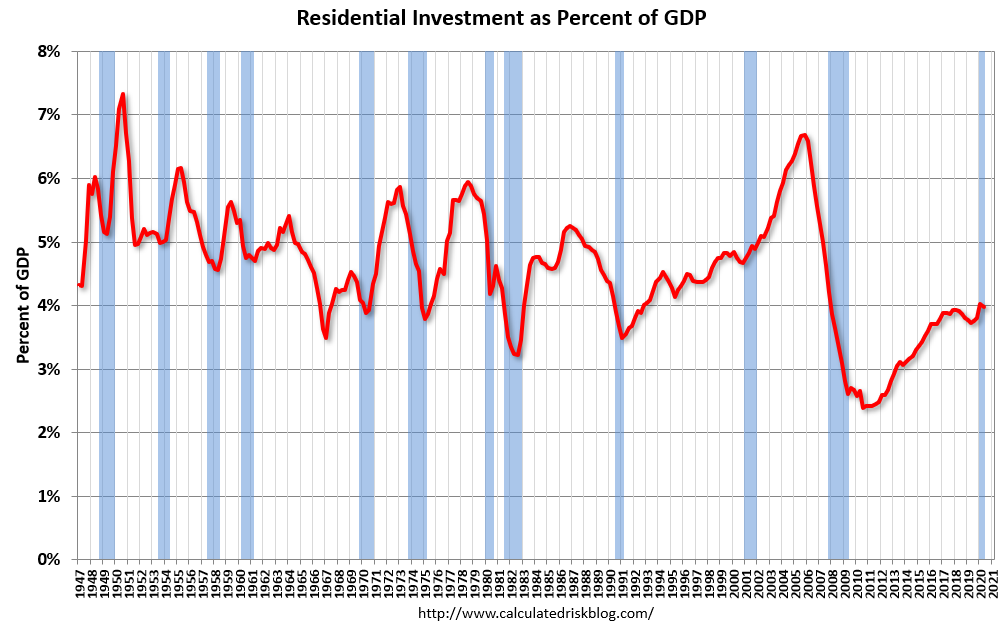 The second graph shows residential investment as a percent of GDP.
Residential Investment as a percent of GDP decreased slightly in Q2 (this means RI slumped slightly more than the overall economy in Q2). RI as a percent of GDP is close to the bottom of the previous recessions – and prior to the pandemic, I expected RI to continue to increase further in this cycle.
I’ll break down Residential Investment into components after the GDP details are released.
Note: Residential investment (RI) includes new single family structures, multifamily structures, home improvement, broker’s commissions, and a few minor categories.
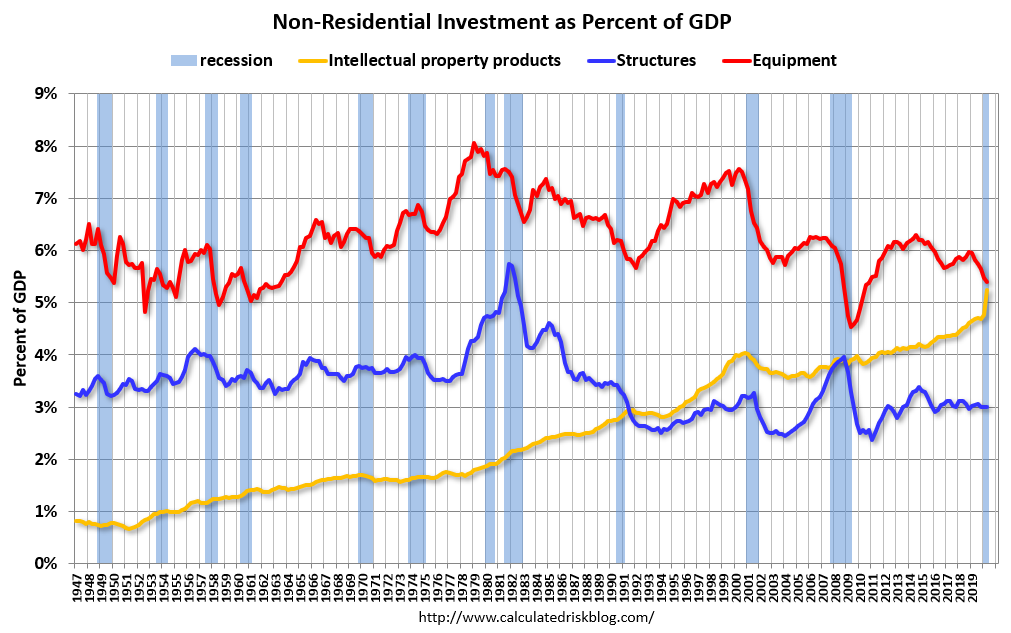 The third graph shows non-residential investment in structures, equipment and “intellectual property products”. Investment in equipment declined more than the overall economy.