From the Association of American Railroads (AAR) Rail Time Indicators. Graphs and excerpts reprinted with permission.
U.S. rail traffic in July was mixed, but overall it pointed to continued slow recovery (especially when coal is out of the picture) from April’s low point. Total U.S. originated carloads averaged 208,403 per week in July 2020, the most since March 2020 but also by far the lowest for July since prior to 1988, when our data begin. July’s decline was 17.6%, the smallest decline since March 2020. Excluding coal, U.S. carloads were down 12.7% in July
emphasis added
 Click on graph for larger image.
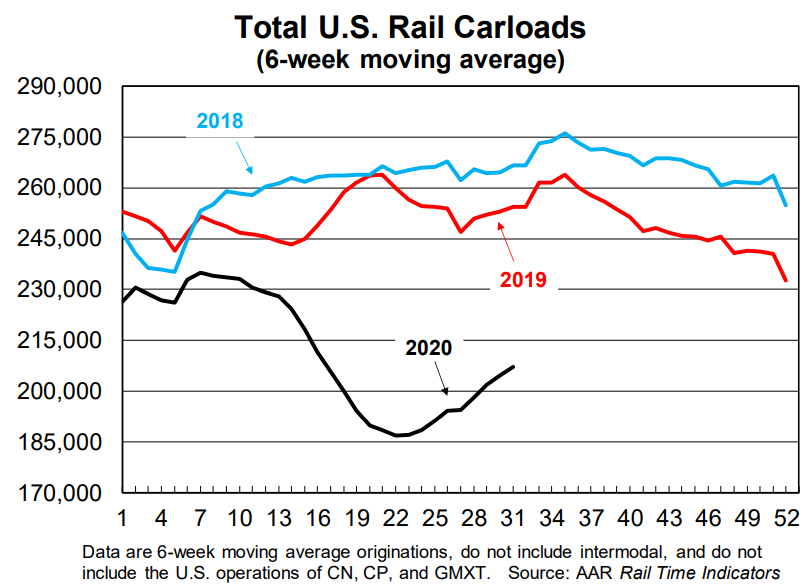
This graph from the Rail Time Indicators report shows the six week average of U.S. Carloads in 2018, 2019 and 2020:
Total originated carloads on U.S. railroads averaged 208,403 per week in July 2020. That’s the most since March 2020, but it’s also by far the lowest weekly average for July since our records begin in 1988. Total carloads were down 17.6% in July 2020 from July 2019. That’s the 18th straight year-over-year decline but the smallest percentage decline since March 2020. Total carloads in the first seven months of 2020 were down 16.2%, or 1.27 million carloads.
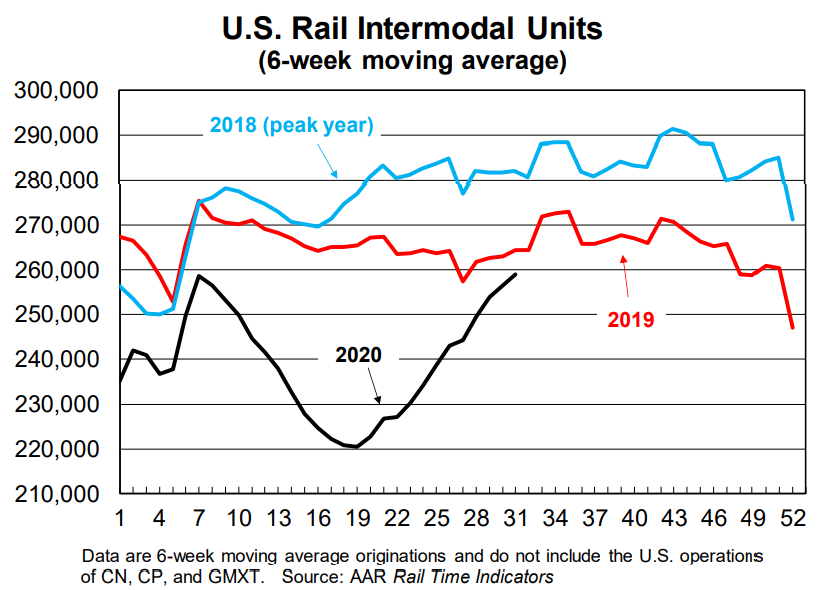 The second graph shows the six week average of U.S. intermodal in 2018, 2019 and 2020: (using intermodal or shipping containers):
U.S. intermodal. originations were down just 1.4% in July 2020 from July 2019, their best performance since February 2019. Weekly average originations in July 2020 were 259,192 containers and trailers, the most since October 2019 and a huge improvement from the 2020 low of 219.085 in April. Intermodal originations in the last week of July were 270,277, the most for any week in 2020.
Note that rail traffic was weak prior to the pandemic.