SPECIAL NOTE: The Covid Tracking Project will end daily updates on March 7th. Heroes that filled a critical void! Quality government data will likely be available soon.
From Bloomberg on vaccinations as of Feb 13th.
“In the U.S., more Americans have now received at least one dose than have tested positive for the virus since the pandemic began. So far, 52 million doses have been given, according to a state-by-state tally. In the last week, an average of 1.64 million doses per day were administered.”
Here is the CDC COVID Data Tracker. This site has data on vaccinations, cases and more.
The US is now averaging close to 2.0 million tests per day. Based on the experience of other countries, for adequate test-and-trace (and isolation) to reduce infections, the percent positive needs to be under 5% (probably close to 1%), so the US has far too many daily cases – and percent positive – to do effective test-and-trace.
There were 1,743,784 test results reported over the last 24 hours.
There were 90,199 positive tests.
Over 42,000 US deaths have been reported in February. See the graph on US Daily Deaths here.
This data is from the COVID Tracking Project.
And check out COVID Act Now to see how each state is doing. (updated link to new site)
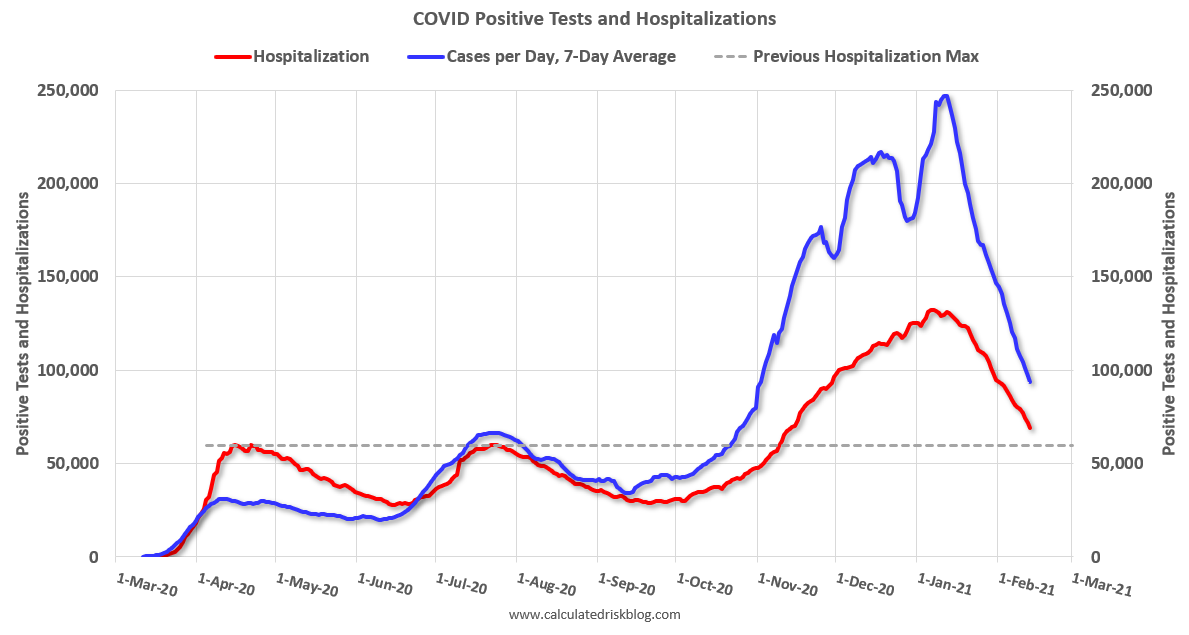 Click on graph for larger image.
This graph shows the 7 day average of positive tests reported and daily hospitalizations.
The percent positive over the last 24 hours was 5.1%. The percent positive is calculated by dividing positive results by total tests (including pending).
Both cases and hospitalizations have peaked, but are still above the previous peaks.