From the Association of American Railroads (AAR) Rail Time Indicators. Graphs and excerpts reprinted with permission.
The U.S. freight rail network is subject to, and sometimes at the mercy of, hurricanes, tornadoes, floods, and other whims of nature. In February, the whims included exceptionally cold and icy conditions in most of the country, including in many areas that aren’t used to it. For rail, it meant reduced operations and, in some areas, complete temporary shutdowns. It was so bad, in fact, that total U.S. rail carloads in the third week of February were the lowest of any week in our records that go back to 1988. Volumes recovered the next week, but the net impact was materially lower rail volumes in February.
In February 2021, U.S total carloads were down 11.1% from February 2020, the biggest percentage decline in six months … However, U.S. intermodal originations were 1.8% higher in February 2021 than in February 2020, continuing what’s now a streak of seven straight months of year-over-year gains.
emphasis added
 Click on graph for larger image.
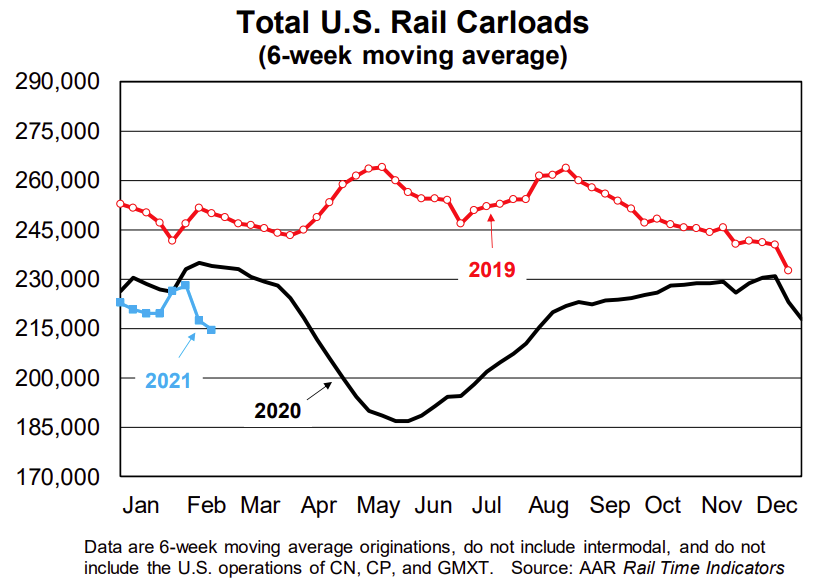
This graph from the Rail Time Indicators report shows the six week average of U.S. Carloads in 2019, 2020 and 2021:
In February, U.S. railroads originated 824,636 total carloads, down 11.1% (102,972 carloads) from February 2020. That’s the biggest year-over-year percentage decline in six months, much worse than the 2.1% decline in January 2021 and 3.7% decline in December 2020. In the third week of February, when the worst of the bad weather struck, the year-over-year decline was 26.3%.
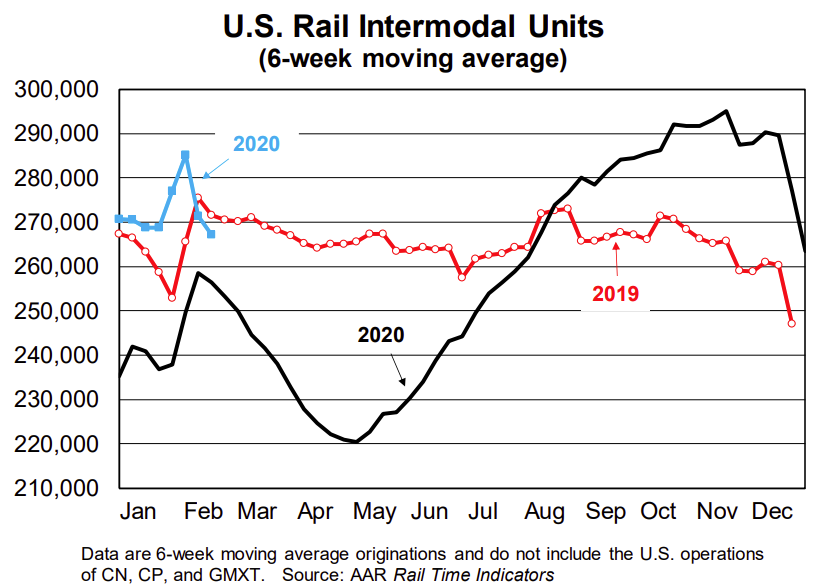 The second graph shows the six week average of U.S. intermodal in 2019, 2020 and 2021: (using intermodal or shipping containers):
U.S. railroads originated 1.02 million intermodal containers and trailers in February 2021, an average of 253,999 per week. That’s 1.8% higher than the weekly average in February 2020, continuing what’s now a streak of seven straight months of year-over-year intermodal gains. U.S. intermodal originations averaged 293,305 per week in January 2021, an all-time record.
Note that rail traffic was weak prior to the pandemic, however intermodal has come back strong.