Note: The year-over-year occupancy comparisons are easy, since occupancy declined sharply at the onset of the pandemic. However, occupancy is still down significantly from normal levels.
The occupancy rate is down 13% compared to the same week in 2019.
U.S. weekly hotel occupancy fell 2.6 percentage points from the previous week, according to STR‘s latest data through April 17.
April 11-17, 2021:
• Occupancy: 57.3%
• Average daily rate (ADR): US$107.16
• Revenue per available room (RevPAR): US$61.37Following the end of spring break, weekly demand fell back below the 22 million mark, and occupancy dipped to its lowest level since mid-March. The ADR level was also US$5 less after two straight weeks above US$112.
emphasis added
For more, see STR’s U.S. Market Recovery Monitor
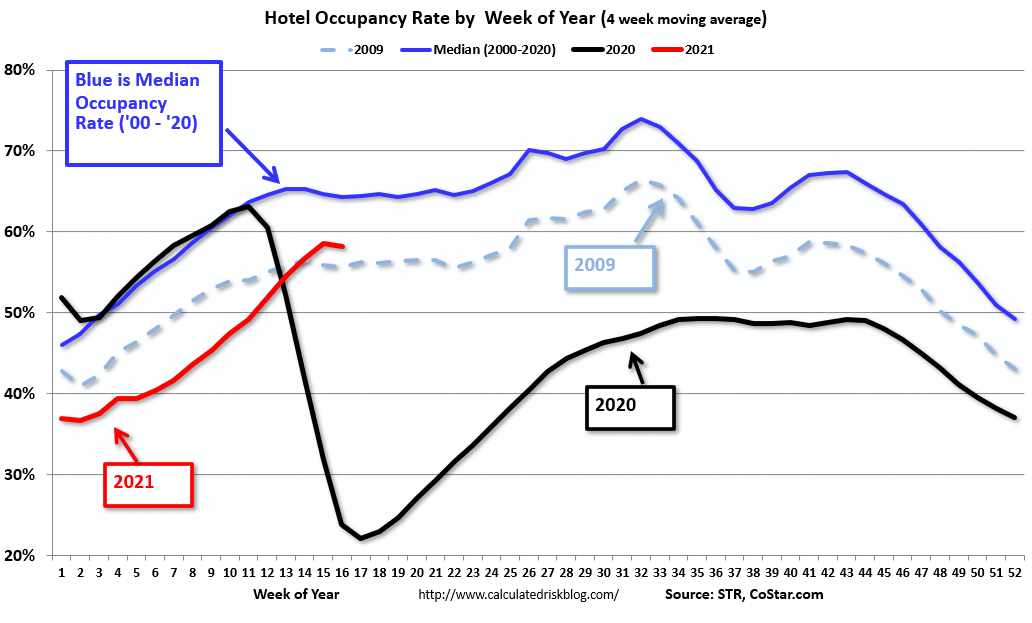
The following graph shows the seasonal pattern for the hotel occupancy rate using the four week average.
 Click on graph for larger image.
The red line is for 2021, black is 2020, blue is the median, and dashed light blue is for 2009 (the worst year since the Great Depression for hotels prior to 2020).
Note: Y-axis doesn’t start at zero to better show the seasonal change.