From the BLS:
Total nonfarm payroll employment rose by 266,000 in April, and the unemployment rate was little changed at 6.1 percent, the U.S. Bureau of Labor Statistics reported today. Notable job gains in leisure and hospitality, other services, and local government education were partially offset by employment declines in temporary help services and in couriers and messengers.
…
The change in total nonfarm payroll employment for February was revised up by 68,000, from +468,000 to +536,000, and the change for March was revised down by 146,000, from +916,000 to +770,000. With these revisions, employment in February and March combined is 78,000 lower than previously reported.
emphasis added
 Click on graph for larger image.
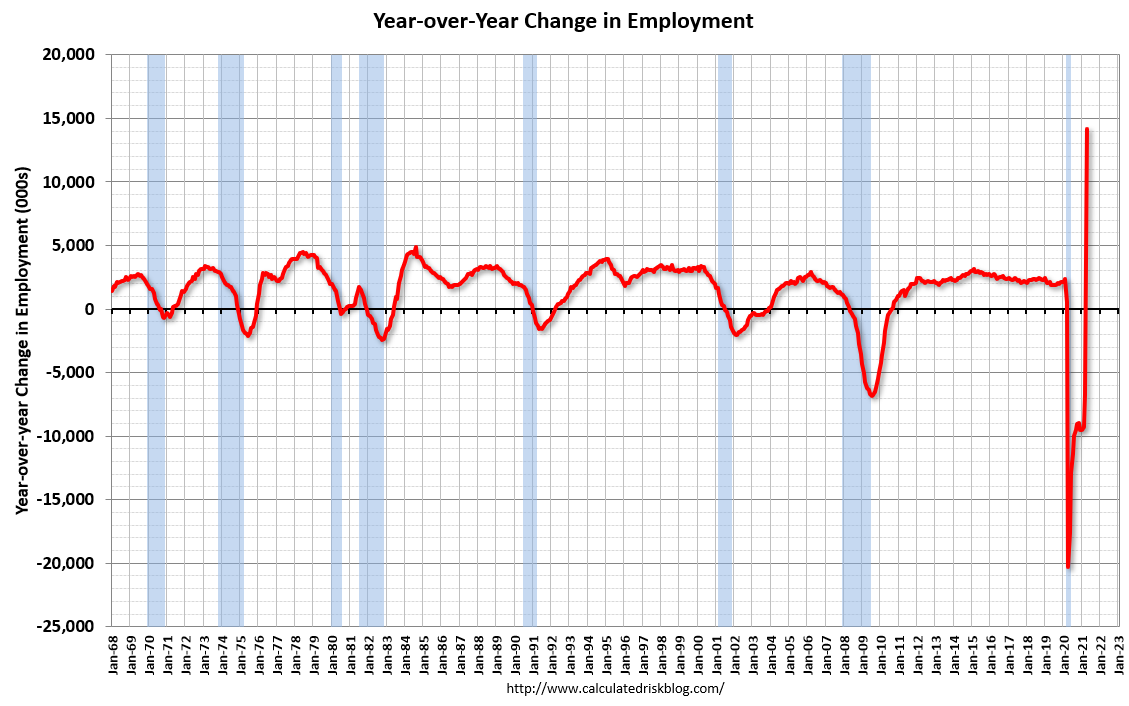
The first graph shows the year-over-year change in total non-farm employment since 1968.
In March, the year-over-year change was 14.147 million jobs. This was up significantly – since employment collapsed in April 2020.
Total payrolls increased by 266 thousand in March. Private payrolls increased by 218 thousand.
Payrolls for February and March were revised down 78 thousand, combined.
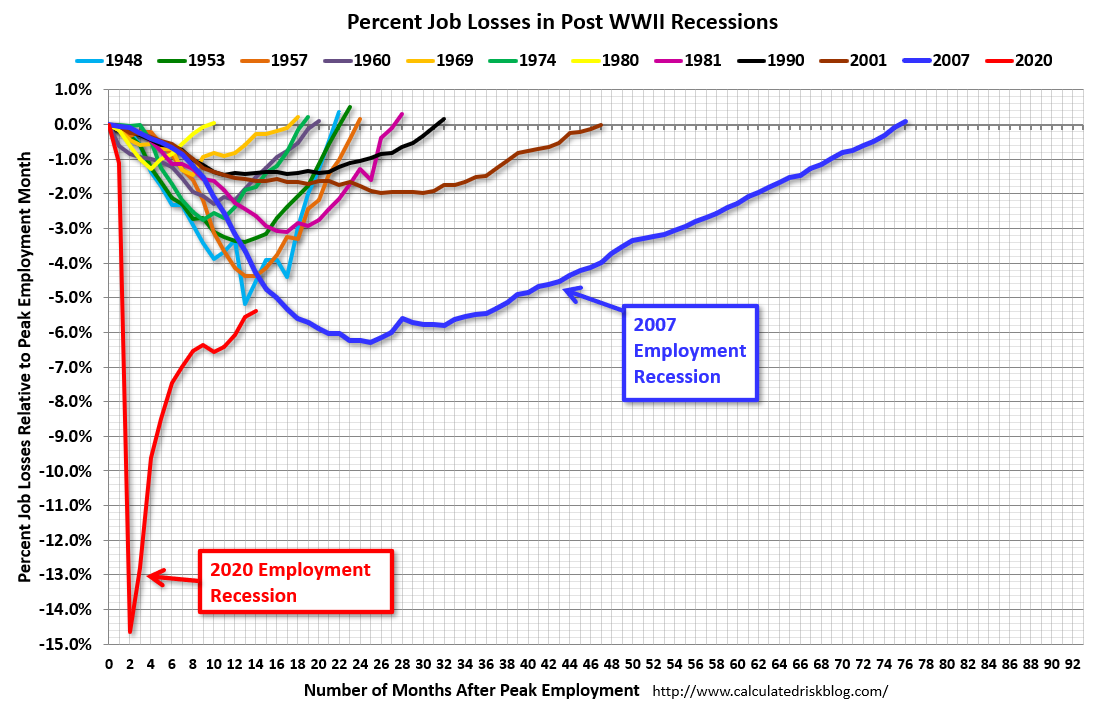 The second graph shows the job losses from the start of the employment recession, in percentage terms.
The current employment recession was by far the worst recession since WWII in percentage terms, but currently is not as severe as the worst of the “Great Recession”.
The third graph shows the employment population ratio and the participation rate.
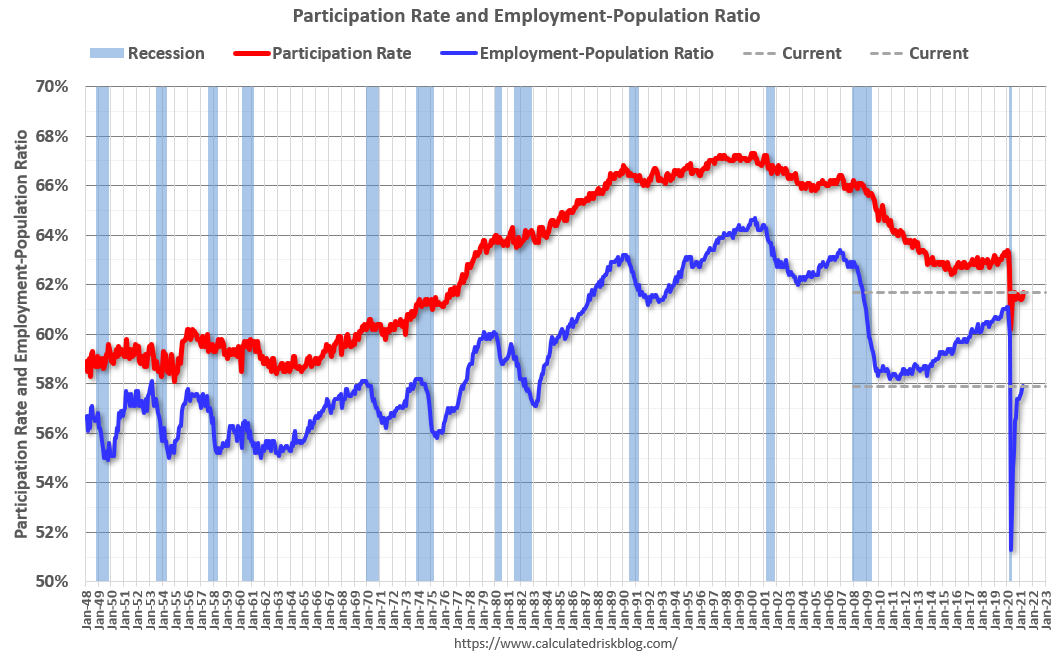 The Labor Force Participation Rate increased to 61.7% in April, from 61.7% in March. This is the percentage of the working age population in the labor force.
The Employment-Population ratio increased to 57.9% from 57.8% (black line).
I’ll post the 25 to 54 age group employment-population ratio graph later.
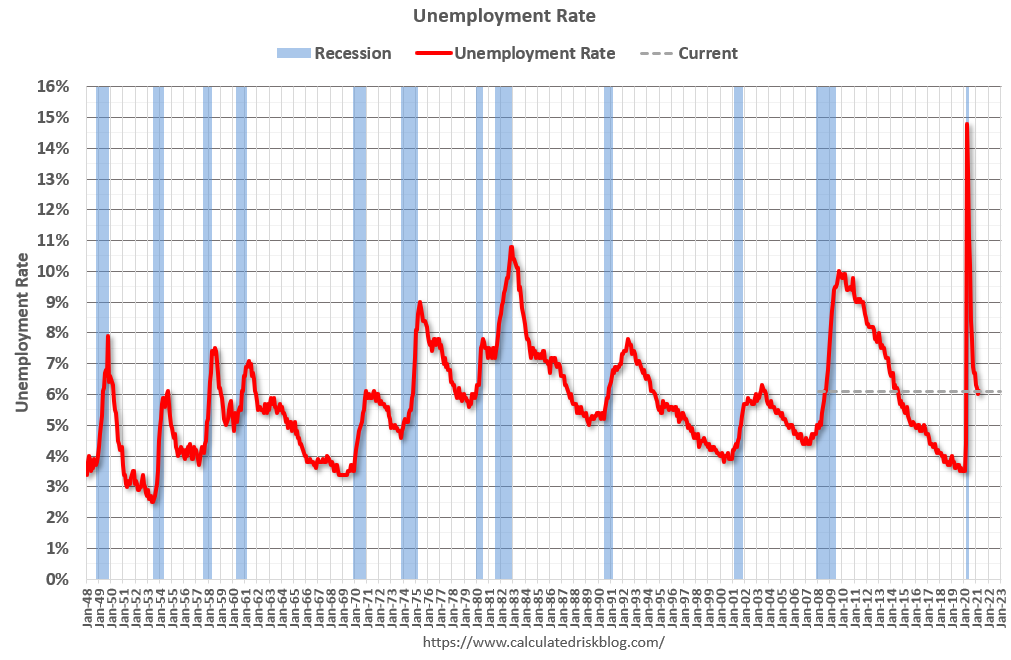 The fourth graph shows the unemployment rate.
The unemployment rate increased in April to 6.1% from 6.0% in March.
This was well below consensus expectations, and February and March were revised down by 78,000 combined.