There was little economic data released this week. The trade deficit was much higher than expected, however the data might have been impacted by the port strike on the west coast. The BLS reported job openings were up about 12% year-over-year and the 4-week average for initial weekly unemployment claims increased a little. Not much data, but next week will be busy!
Some quarterly data was released for office, apartment and mall vacancy rates and rents. All vacancy rates declined, although both office and mall rates are still near the cycle high – and apartment vacancy rates are already low.
Here are some thoughts on the economy in 2013:
• Question #1 for 2013: US Fiscal Policy
• Question #2 for 2013: Will the U.S. economy grow in 2013?
• Question #3 for 2013: How many payroll jobs will be added in 2013?
• Question #4 for 2013: What will the unemployment rate be in December 2013?
• Question #5 for 2013: Will the inflation rate rise or fall in 2013?
• Question #6 for 2013: What will happen with Monetary Policy and QE3?
• Question #7 for 2013: What will happen with house prices in 2013?
• Question #8 for 2013: Will Housing inventory bottom in 2013?
• Question #9 for 2013: How much will Residential Investment increase?
• Question #10 for 2013: Europe and the Euro
And here is a summary of last week in graphs:
• Trade Deficit increased in November to $48.7 Billion
 Click on graph for larger image.
From Commerce: “[T]otal November exports of $182.6 billion and imports of $231.3 billion resulted in a goods and services deficit of $48.7 billion, up from $42.1 billion in October, revised. November exports were $1.7 billion more than October exports of $180.8 billion. November imports were $8.4 billion more than October imports of $222.9 billion.”
Exports are 10% above the pre-recession peak and up 3.3% compared to November 2011; imports are near the pre-recession peak, and up 2.5% compared to November 2011.
The increase in the trade deficit in November was due to non-petroleum products. The trade deficit with the euro area was $10.6 billion in November, up from $8.2 billion in November 2011. It appears the eurozone recession is still impacting trade.
Note: The trade deficit might have been skewed by the port strike that started in late November.
• BLS: Job Openings “unchanged” in November
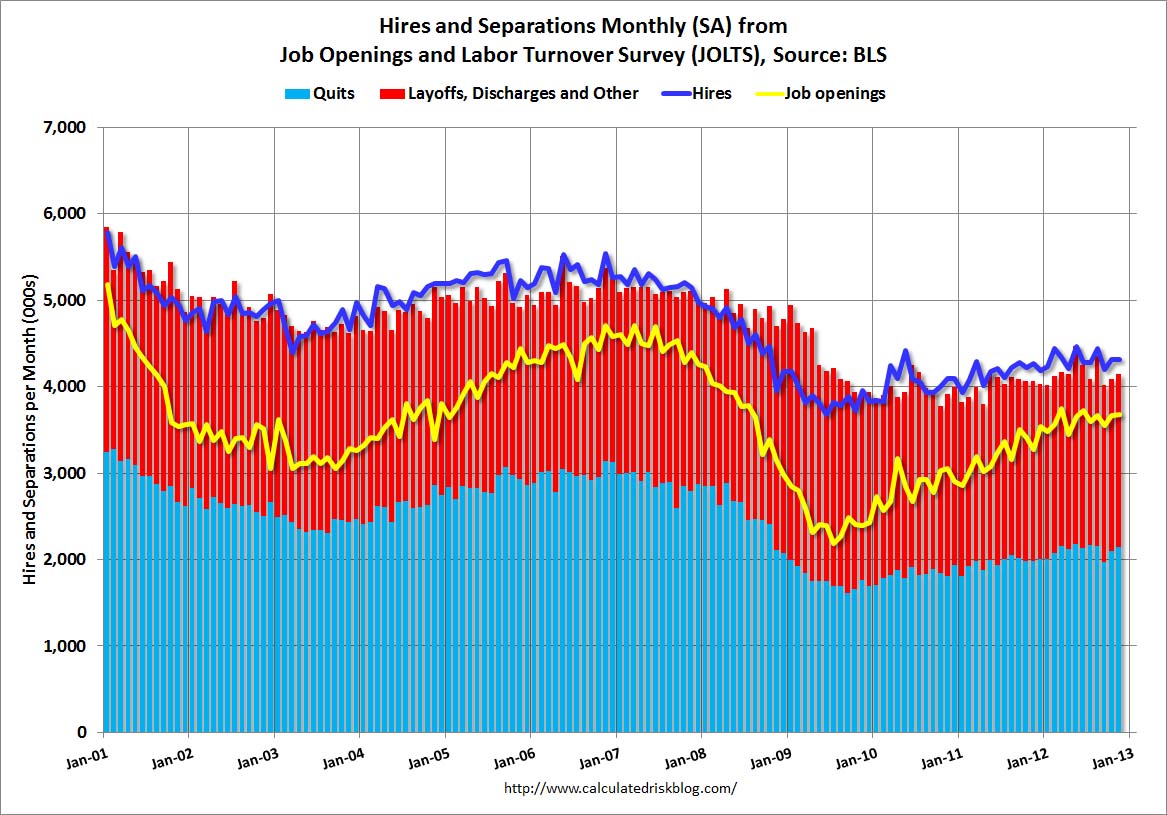 This graph shows job openings (yellow line), hires (dark blue), Layoff, Discharges and other (red column), and Quits (light blue column) from the JOLTS.
Notice that hires (dark blue) and total separations (red and light blue columns stacked) are pretty close each month. This is a measure of turnover. When the blue line is above the two stacked columns, the economy is adding net jobs – when it is below the columns, the economy is losing jobs.
Jobs openings increased slightly in November to 3.676 million, up from 3.665 million in October. The number of job openings (yellow) has generally been trending up, and openings are up about 12% year-over-year compared to November 2011. Quits increased slightly in November, and quits are up 8% year-over-year. These are voluntary separations. (see light blue columns at bottom of graph for trend for “quits”).
Not much changes month-to-month in this report, but the trend suggests a gradually improving labor market.
All current employment graphs
• Weekly Initial Unemployment Claims at 371,000
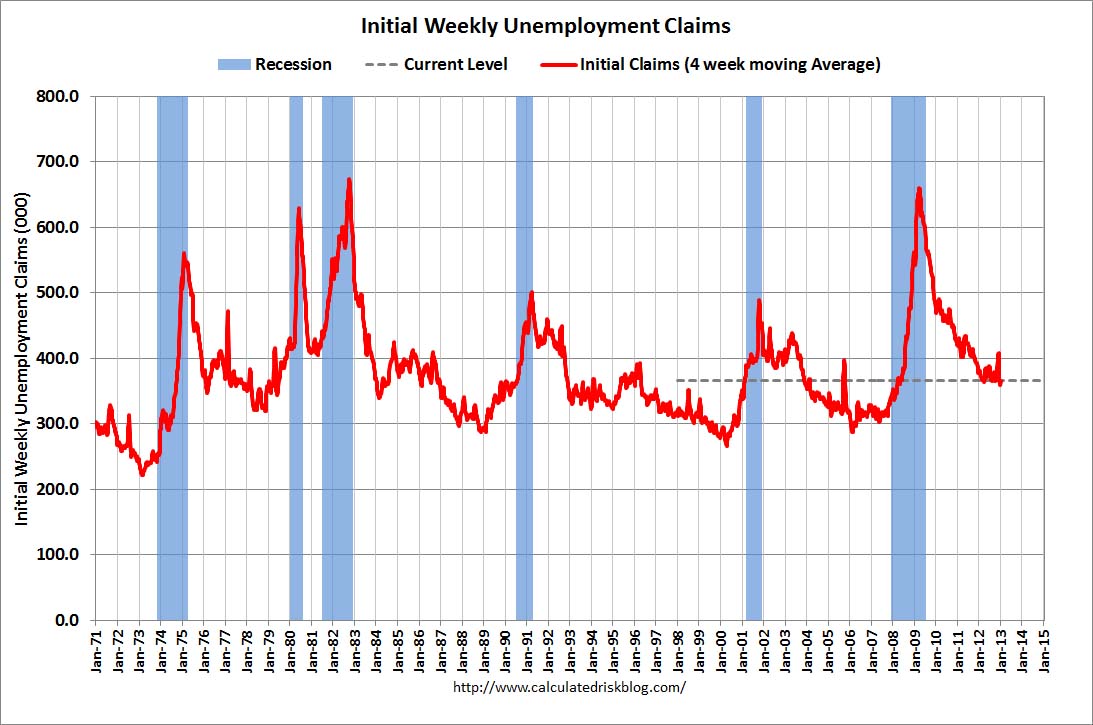 From the Department of Labor (DOL): “In the week ending January 5, the advance figure for seasonally adjusted initial claims was 371,000, an increase of 4,000 from the previous week’s revised figure of 367,000. The 4-week moving average was 365,750, an increase of 6,750 from the previous week’s revised average of 359,000.
Weekly claims were above the 362,000 consensus forecast.
Note: There are large seasonal factors in December and January, and that can make for fairly large swings for weekly claims.
All current Employment Graphs
• Reis: Office Vacancy Rate declines slightly in Q4 to 17.1%
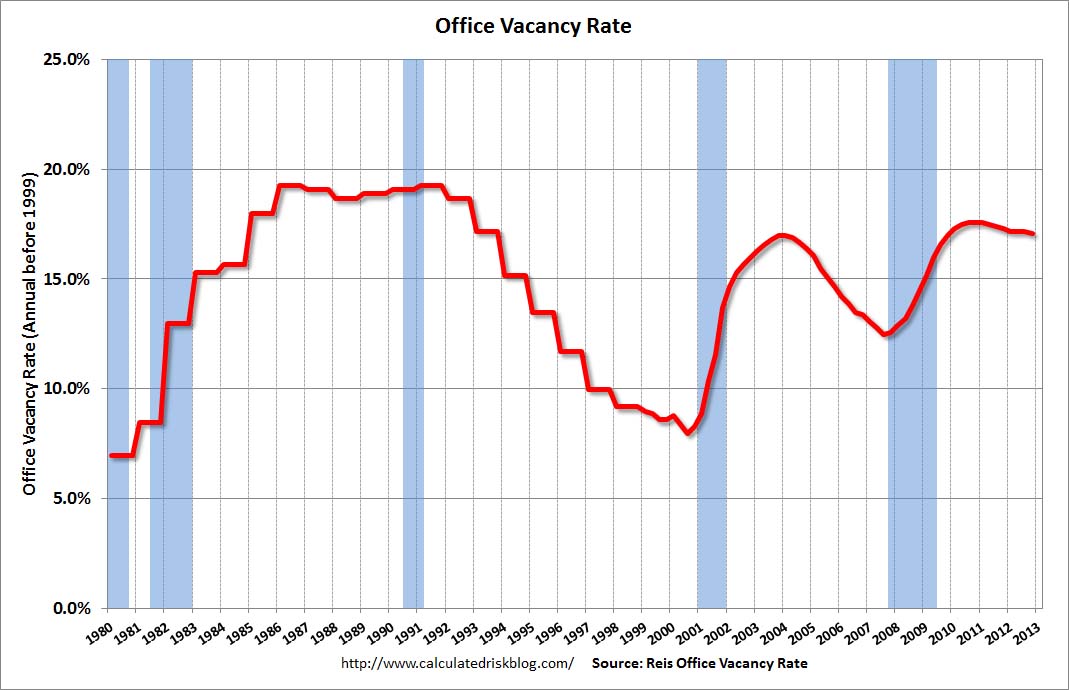 Reis reported that the office vacancy rate declined slightly to 17.1% from 17.2% in Q3.
This graph shows the office vacancy rate starting in 1980 (prior to 1999 the data is annual).
The vacancy rate peaked in this cycle at 17.6% in Q3 and Q4 2010, and Q1 2011.
As Reis noted, net absorption was still positive, even though demand for office space was low – because there is so little new construction. This remains a sluggish recovery for office space, and new construction will stay low until the vacancy rate falls much further.
• Reis: Apartment Vacancy Rate declined to 4.5% in Q4
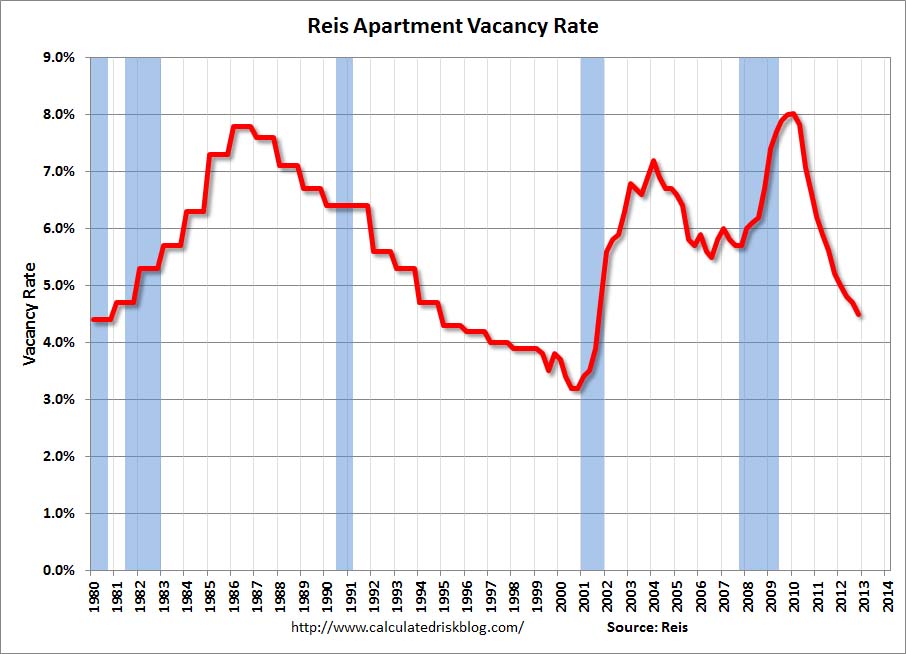 Reis reported that the apartment vacancy rate fell to 4.5% in Q4, down from 4.7% in Q3 2012. The vacancy rate was at 5.2% in Q4 2011 and peaked at 8.0% at the end of 2009.
This graph shows the apartment vacancy rate starting in 1980. (Annual rate before 1999, quarterly starting in 1999). Note: Reis is just for large cities.
This was another strong quarter for apartments with the vacancy rate falling and rents rising. With more supply coming online in 2013, the decline in the vacancy rate should slow – but the market is still tight, and Reis expects rents to continue to increase.
• Reis: Mall Vacancy Rate declines in Q4
 Reis reported that the vacancy rate for regional malls declined to 8.6% in Q4 from 8.7% in Q3. This is down from a cycle peak of 9.4% in Q3 2011.
For Neighborhood and Community malls (strip malls), the vacancy rate declined to 10.7% in Q4, down from 10.8% in Q3. For strip malls, the vacancy rate peaked at 11.1% in Q3 2011.
This graph shows the strip mall vacancy rate starting in 1980 (prior to 2000 the data is annual). The regional mall data starts in 2000. Back in the ’80s, there was overbuilding in the mall sector even as the vacancy rate was rising. This was due to the very loose commercial lending that led to the S&L crisis.
In the mid-’00s, mall investment picked up as mall builders followed the “roof tops” of the residential boom (more loose lending). This led to the vacancy rate moving higher even before the recession started. Then there was a sharp increase in the vacancy rate during the recession and financial crisis.
The yellow line shows mall investment as a percent of GDP through Q3. This has increased from the bottom because this includes renovations and improvements. New mall investment has essentially stopped.
The good news is, as Reis noted, new square footage is near a record low, and with very little new supply, the vacancy rate will probably continue to decline slowly.
Vacancy data courtesy of Reis.