In addition to Case-Shiller, CoreLogic, FHFA and LPS, I’m also watching the FNC, Zillow and several other house price indexes.
From FNC: Home Prices Up 0.3% in November; Price Increase Expected to Continue
Based on recorded sales of non-distressed properties (existing and new homes) in the 100 largest metropolitan areas, the FNC 100-MSA composite index shows that home prices nationally were up 0.3% in November. This was the ninth consecutive month that prices moved higher, leading to a total appreciation rate of 5.3% year to date. For the 12 months ending in November, home prices rose 4.2%, the largest year-over-year increase since October 2006. All three composite indices show similar trends of price recovery. …
Two-thirds of the component markets tracked by the FNC 30-MSA composite index show continued price improvement in November. Las Vegas recorded the largest month-to-month increase, up 3.4% from October. Low inventory has contributed to the city’s rapidly rising prices in recent months. Chicago continues to lag behind other major cities in the housing recovery; home prices declined 0.8% in the 12 months ending in November. The city’s foreclosure sales remain at elevated levels; one in three homes sold are foreclosures or short sales. The recovery in Phoenix continues to significantly outpace the rest of the country. Home prices have surged 23.6% year to date. Foreclosure sales continue to shrink rapidly, making up only 13.0% of total home sales in November.
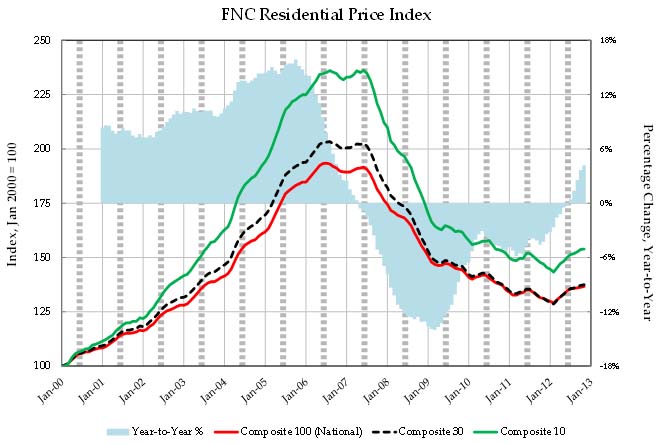
The year-over-year change continued to increase in November, with the 100-MSA composite up 4.2% compared to November 2011. The FNC index turned positive on a year-over-year basis in July – that was the first year-over-year increase in the FNC index since year-over-year prices started declining in early 2007 (over five years ago).
 Click on graph for larger image.
This graph from FNC shows their Composite 10, 20, and 100 indexes, and the year-over-year change (light blue) in the composite 100 index. Note: The FNC indexes are hedonic price indexes using a blend of sold homes and real-time appraisals.
The key is the indexes are now showing a year-over-year increase indicating prices probably bottomed early in 2012.