Time flies! It was five years ago that we started discussing the turnaround for apartments. Then, in January 2011, I attended the NMHC Apartment Strategies Conference in Palm Springs, and the atmosphere was very positive. (Note: This is an update to a post I wrote a year ago).
The drivers were 1) very low new supply, and 2) strong demand (favorable demographics, and people moving from owning to renting).
Demographics are still favorable, but my sense is the move “from owning to renting” has slowed. And more supply has been coming online.
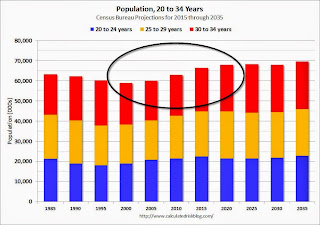
On demographics, a large cohort has been moving into the 20 to 34 year old age group (a key age group for renters). Also, in 2015, based on Census Bureau projections, the two largest 5 year cohorts are 20 to 24 years old, and 25 to 29 years old (the largest cohorts are no longer be the “boomers”). Note: Household formation would be a better measure than population, but reliable data for households is released with a long lag.
 Click on graph for larger image.
This graph shows the population in the 20 to 34 year age group has been increasing. This is actual data from the Census Bureau for 1985 through 2010, and current projections from the Census Bureau from 2015 through 2035.
The circled area shows the recent and projected increase for this group.
From 2020 to 2030, the population for this key rental age group is expected to remain mostly unchanged.
This favorable demographic is a key reason I’ve been positive on the apartment sector for the last five years – and I expect new apartment construction to stay strong for a few more years.
And on supply, the table below shows the number of 5+ units started and completed per year since 1990 (Completions matter for supply). New supply will probably increase by 250,000 to 260,000 units this year – and increase further in 2015 since it can take over a year from start to completion for large complexes. Note: This doesn’t include houses converted to rentals – and that is a substantial number in recent years.
This suggests new supply will probably balance demand soon, and that means vacancy rates have likely bottomed.
| 5+ Units, Starts and Completions (000s)1 | ||
|---|---|---|
| Year | Completions | Starts |
| 1990 | 297.3 | 260.4 |
| 1991 | 216.6 | 137.9 |
| 1992 | 158.0 | 139.0 |
| 1993 | 127.1 | 132.6 |
| 1994 | 154.9 | 223.5 |
| 1995 | 212.4 | 244.1 |
| 1996 | 251.3 | 270.8 |
| 1997 | 247.1 | 295.8 |
| 1998 | 273.9 | 302.9 |
| 1999 | 299.3 | 306.6 |
| 2000 | 304.7 | 299.1 |
| 2001 | 281.0 | 292.8 |
| 2002 | 288.2 | 307.9 |
| 2003 | 260.8 | 315.2 |
| 2004 | 286.9 | 303.0 |
| 2005 | 258.0 | 311.4 |
| 2006 | 284.2 | 292.8 |
| 2007 | 253.0 | 277.3 |
| 2008 | 277.2 | 266.0 |
| 2009 | 259.8 | 97.3 |
| 2010 | 146.5 | 104.3 |
| 2011 | 129.9 | 167.3 |
| 2012 | 157.6 | 233.9 |
| 2013 | 186.2 | 293.7 |
| 2014 | 255.6 | 341.7 |
| 20152 | 265.0 | 350.0 |
| 1 5+ units is close to the number of units built for rent each year. | ||
| 2 Pace through March 2015, completions will probably be above 270,000 for 2015 | ||