From housing economist Tom Lawler: Sustained Regional Home Price Declines Were Not That Uncommon from the Mid-80’s to the Mid-90’s
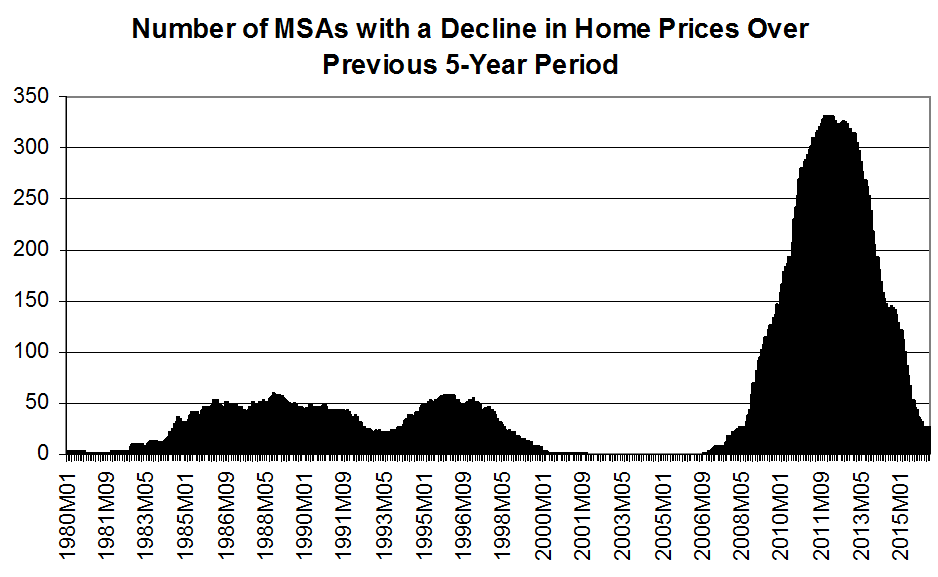
During any 5-year period that including any part the late 70’s there were virtually no areas that experienced a drop in home prices. That isn’t too surprising given the high inflation rate/nominal income growth rate of the period. What was more surprising is that for any 5-year periods ending from early 2000 (which basically means the latter half of the 1990’s) to the fall of 2006 there were no MSA which experienced a drop in home prices, since those periods were characterized by relative modest inflation and nominal income growth.
It is worth noting that most “models” of mortgage defaults used in the early and mid 2000’s were based on loans originated from 1995/6 or later, as it was around then that the use of credit scores become widespread. As such, these “models” used a period when there were hardly any parts of the country where home prices had declined. … During this period actual mortgage losses were incredibly low, models predicted low losses going forward, and in hindsight it’s not surprising that mortgage lending criteria eased considerably over the period, moving from “historically very easy” in 2000-2001 to “ridiculously easy” in the 2003-2006” period.
 Click on graph for larger image.
Chart uses Freddie Mac’s Home Price Index for 381 MSAs. The chart shows the number of MSA HPIs that declined over a rolling 5-year (60 month) period.
These models based on “good times” proved to be useless in predicting how mortgages performed during “bad times,” which was “a tragedy” that was predicted by the band Poison in its most excellent song “Good Times, Bad Times, How Life Loves a Tragedy.”1
1See, e.g., “Model Stability and the Subprime Mortgage Crisis,” An, Deng, Rosenblatt, and Yen, September 2010.
CR Note: These are some key point in understanding the bubble. The models used to predict defaults were based on a period with rising home prices, and also on a period with different lending criteria. In the early ’90s, lending was based on the 3Cs (Collateral, Capacity, and Credit), and that moved to mostly credit scores in the 2000s.