Note: Before the employment report is released each month, Chicago Fed economist Francois Gourio provides an estimate of the impact of weather on employment (this has been very useful).
After the employment report is released, the San Francisco Fed has a model that shows weather adjusted employment. See: Weather-Adjusted Employment Change
This page provides estimates of weather-adjusted employment change in the United States for the past six months. Beginning with the official Bureau of Labor Statistics (BLS) series on the monthly change in total nonfarm payroll employment, we adjust for deviations of weather from seasonal norms following the methodology described in Wilson (2016).
The approach involves estimating the short-run effects of unusual weather on employment growth at the county level using historical data from January 1990 through December 2015. We then use the statistical model to estimate the effect of unusual weather in recent months on employment growth at the county level. We aggregate these county-level effects to the national level, weighting counties by employment levels, to yield estimates of the effect of unusual weather around the country on national employment growth. Finally, we translate these growth effects into level effects using the level of employment in November 2015 as an initial base.
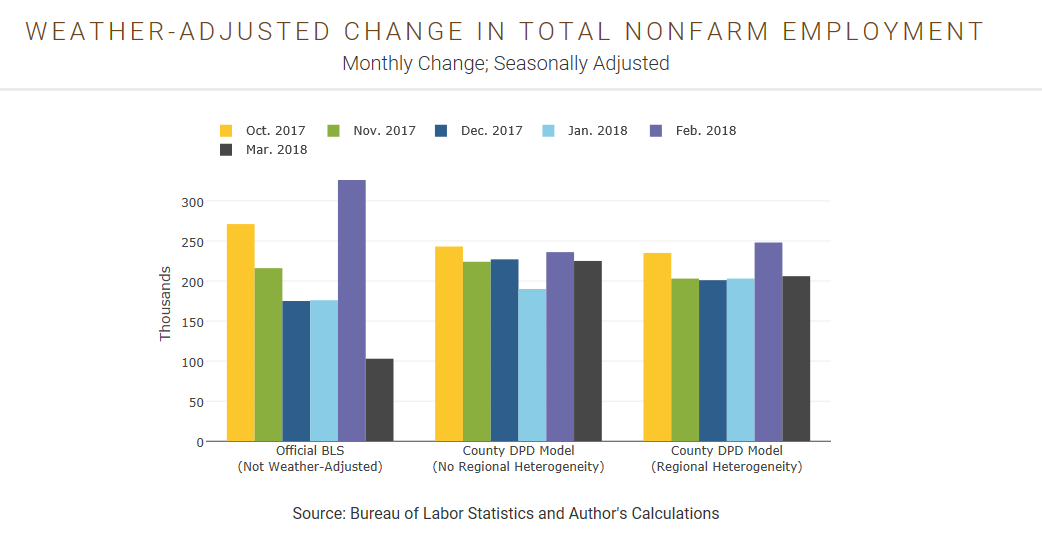
The figure and table present three employment change series for the past six months. The first (left) group is the official BLS series. The other two are alternative estimates of weather-adjusted employment change calculated using our county-level statistical model estimated over the January 1990–December 2015 period. The second set of bars is shows the most recent county-level series (also shown in Figure 2 of van der List and Wilson 2016). The third set of bars is an extension of the county-level model that allows for each weather variable to have different marginal effects in each of the Census Bureau’s nine regions. For example, an inch of snowfall can have a different effect on employment growth in the South Atlantic region than it does in New England.
 Click on graph for larger image.
This graph from the San Francisco Fed show employment gains as reported by the BLS (left graph), and two weather adjusted graphs.
The San Francisco Fed estimates weather reduced March employment by about 100,000 jobs.
There is also a table at the weather adjusted website.